
The Root System: A Complete Guide to Insulin Resistance
Part One: The Normal Biology of Insulin Resistance

A quick note before you read: This piece is the densest in this series. It covers molecular biology, evolutionary biology, endocrinology, and metabolic pathophysiology because those layers are necessary to understand everything that follows. Each mechanism is presented in precise scientific terms, and expanded in plain language where needed. The narrative reflects the intricacy of a very complex biological system.

Insulin is one of the most ancient biological signaling molecules ever identified, present in organisms that predate vertebrates by hundreds of millions of years. Researchers have found insulin-related peptides in mollusks and insects, in organisms with no pancreas and no blood glucose regulation in any recognizable sense (Le Roith et al., PNAS, 1980). The system you carry is not new. What is new is the environment you are running it in.
That mismatch is where this story begins.
An Ancient System in a Novel Environment
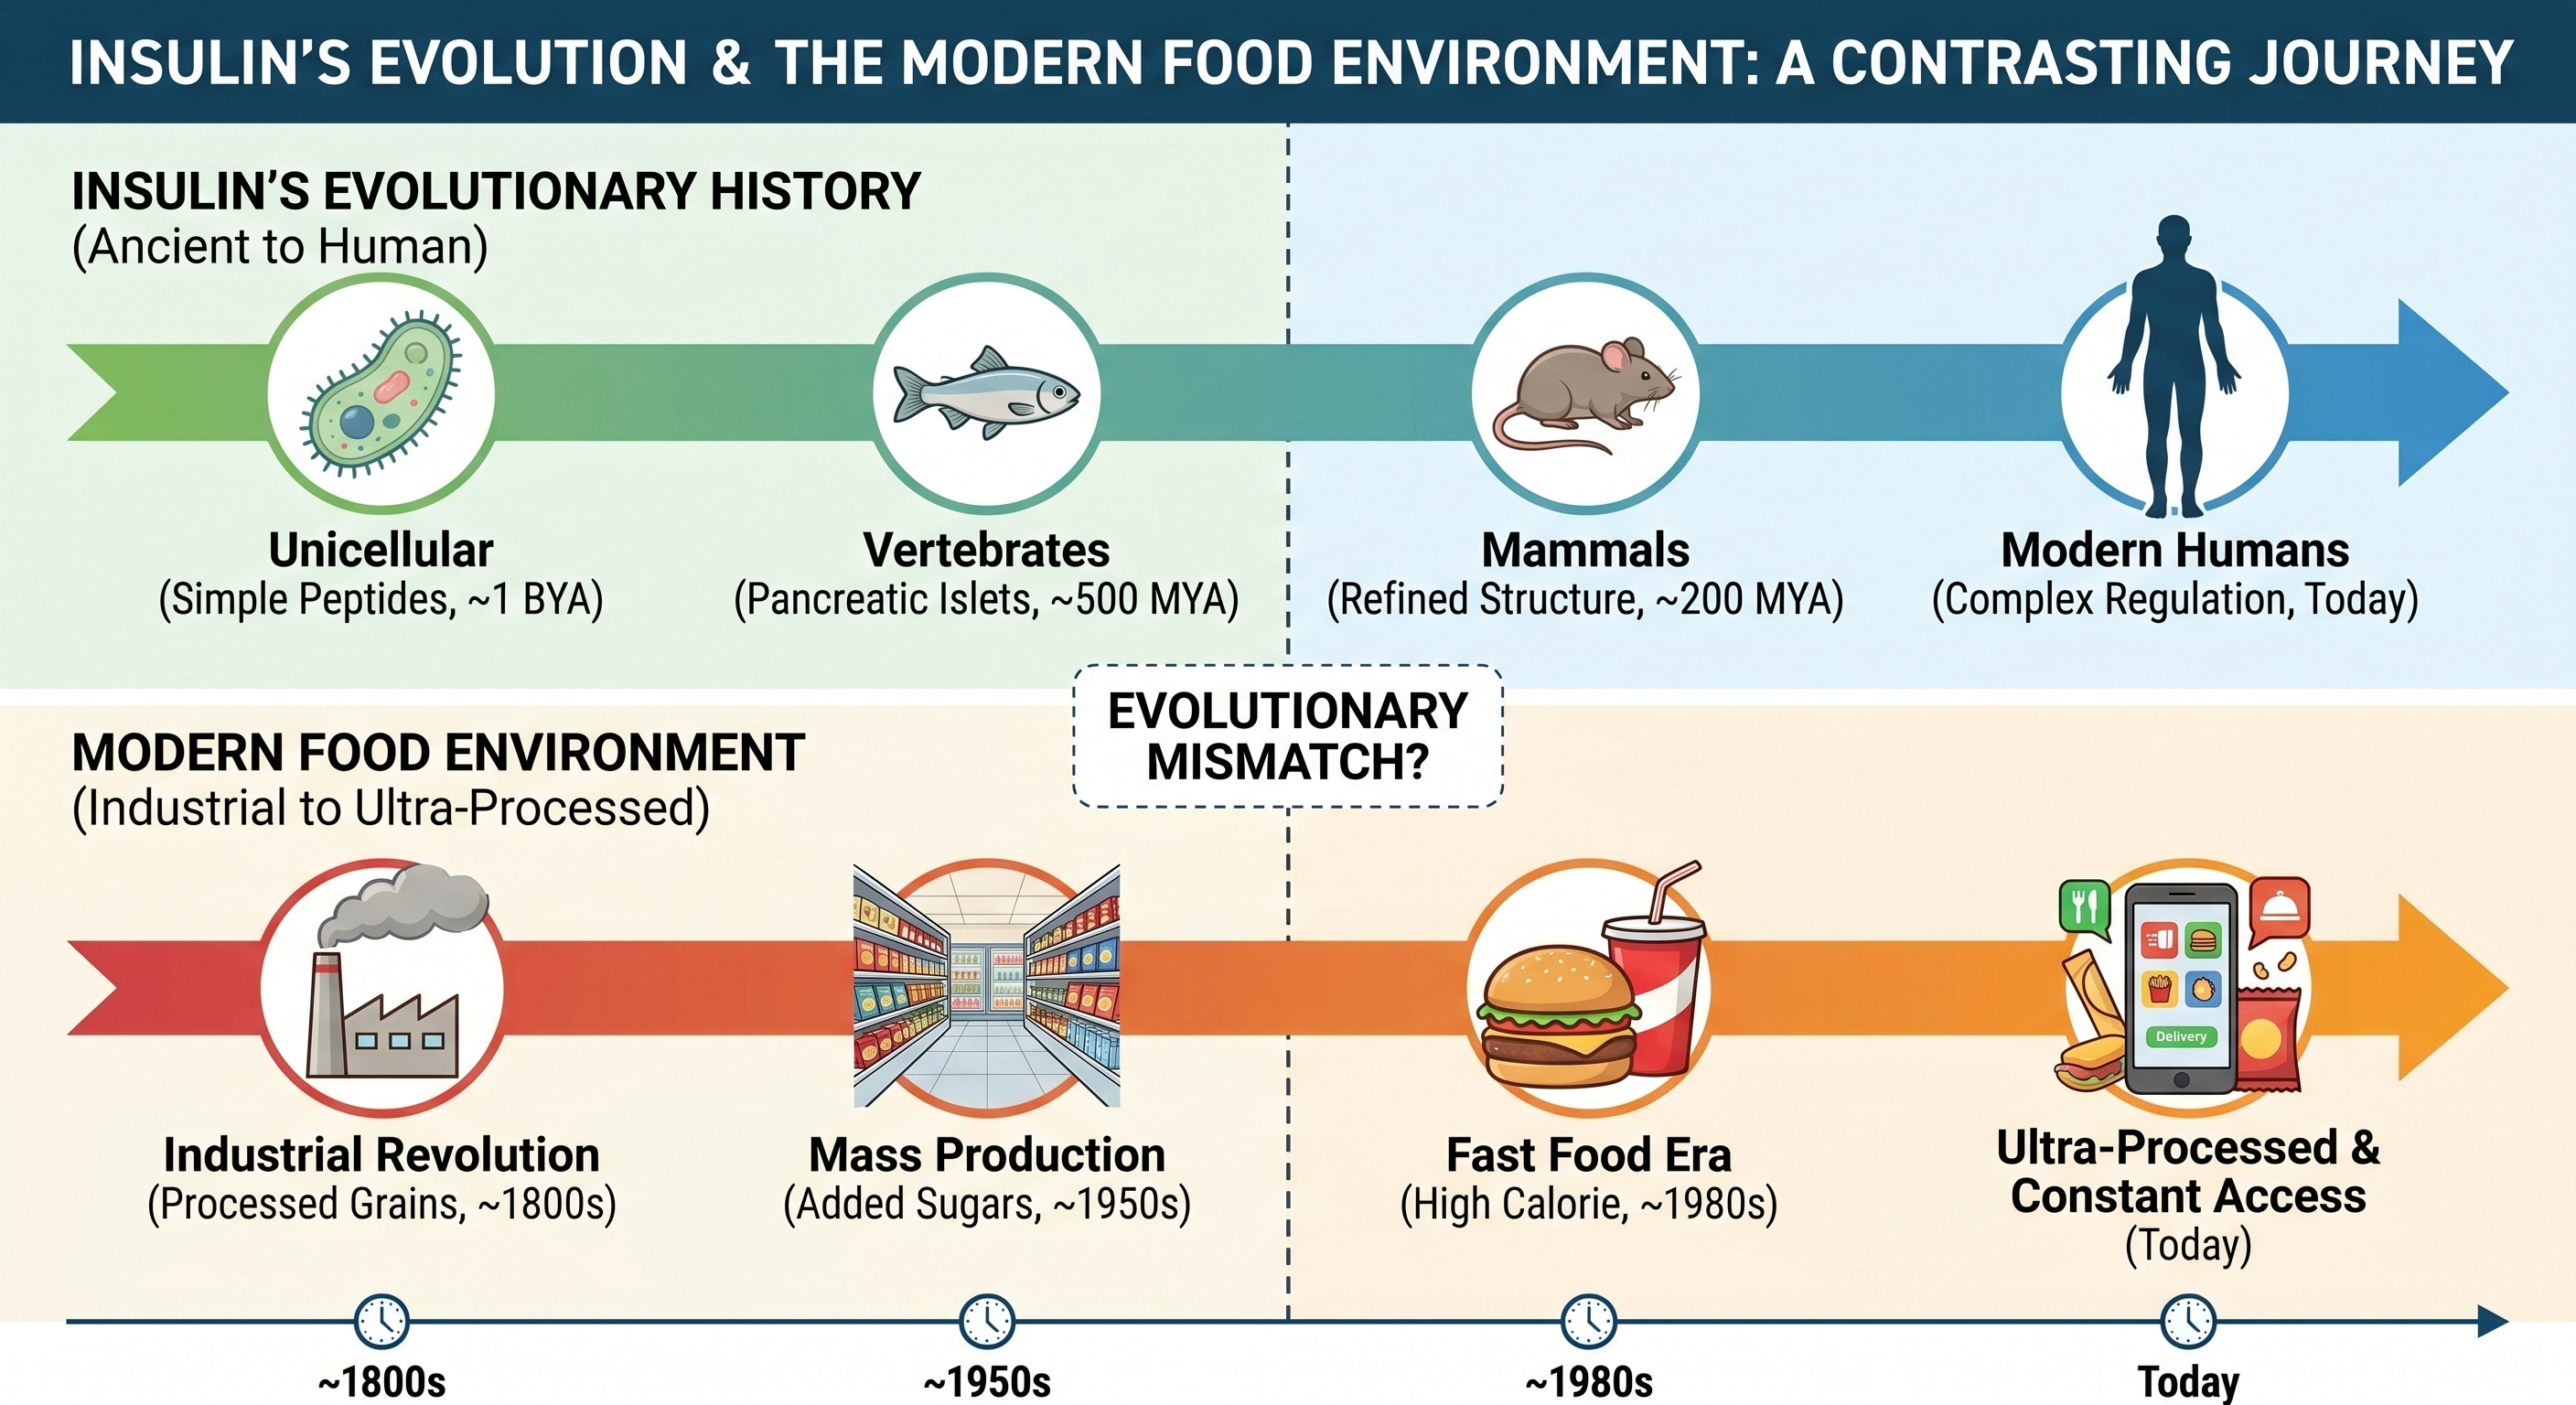
This signaling machinery evolved for a world of intermittent nutrient availability; feast and famine. The system’s design parameters were never three meals a day plus snacks, or foods engineered for maximal palatability and minimal satiation.
This system stores energy aggressively during abundance. It preserves critical fuel reserves during scarcity. It coordinates multiple organs simultaneously to accomplish this. When you understand what it was designed to do, insulin resistance stops looking like a random malfunction. It starts looking like a predictable consequence of running an ancient system under conditions it was never designed for.
How Insulin Is Made and Released
When you eat a meal containing carbohydrate, glucose enters your bloodstream and reaches the beta cells of the pancreatic islets. Those cells contain a specialized glucose transport protein called GLUT2, which allows glucose to enter the cell in direct proportion to its concentration in the blood. Once inside, an enzyme called glucokinase phosphorylates the glucose, initiating its metabolism. As glucose is metabolized, ATP (the main cellular fuel) production rises. That rising ATP-to-ADP ratio closes ATP-sensitive potassium channels in the cell membrane, which depolarizes the membrane, opens voltage-gated calcium channels, and triggers the exocytosis of insulin-containing vesicles into the bloodstream (Matschinsky, Journal of Clinical Investigation, 1990).
In simpler terms, as glucose enter the beta cells it stimulates a proportional release of insulin back into the blood stream. The system modulates its output continuously based on real-time glucose concentration.
Protein also stimulates insulin secretion, though the response is roughly 50 to 70 percent of what an equivalent carbohydrate load would produce, varying by protein source. Protein also stimulates glucagon secretion from the alpha cells of the pancreatic islets, which partially counteracts the glucose lowering effect of insulin and contributes to protein’s superior satiety characteristics.
What Insulin Actually Does
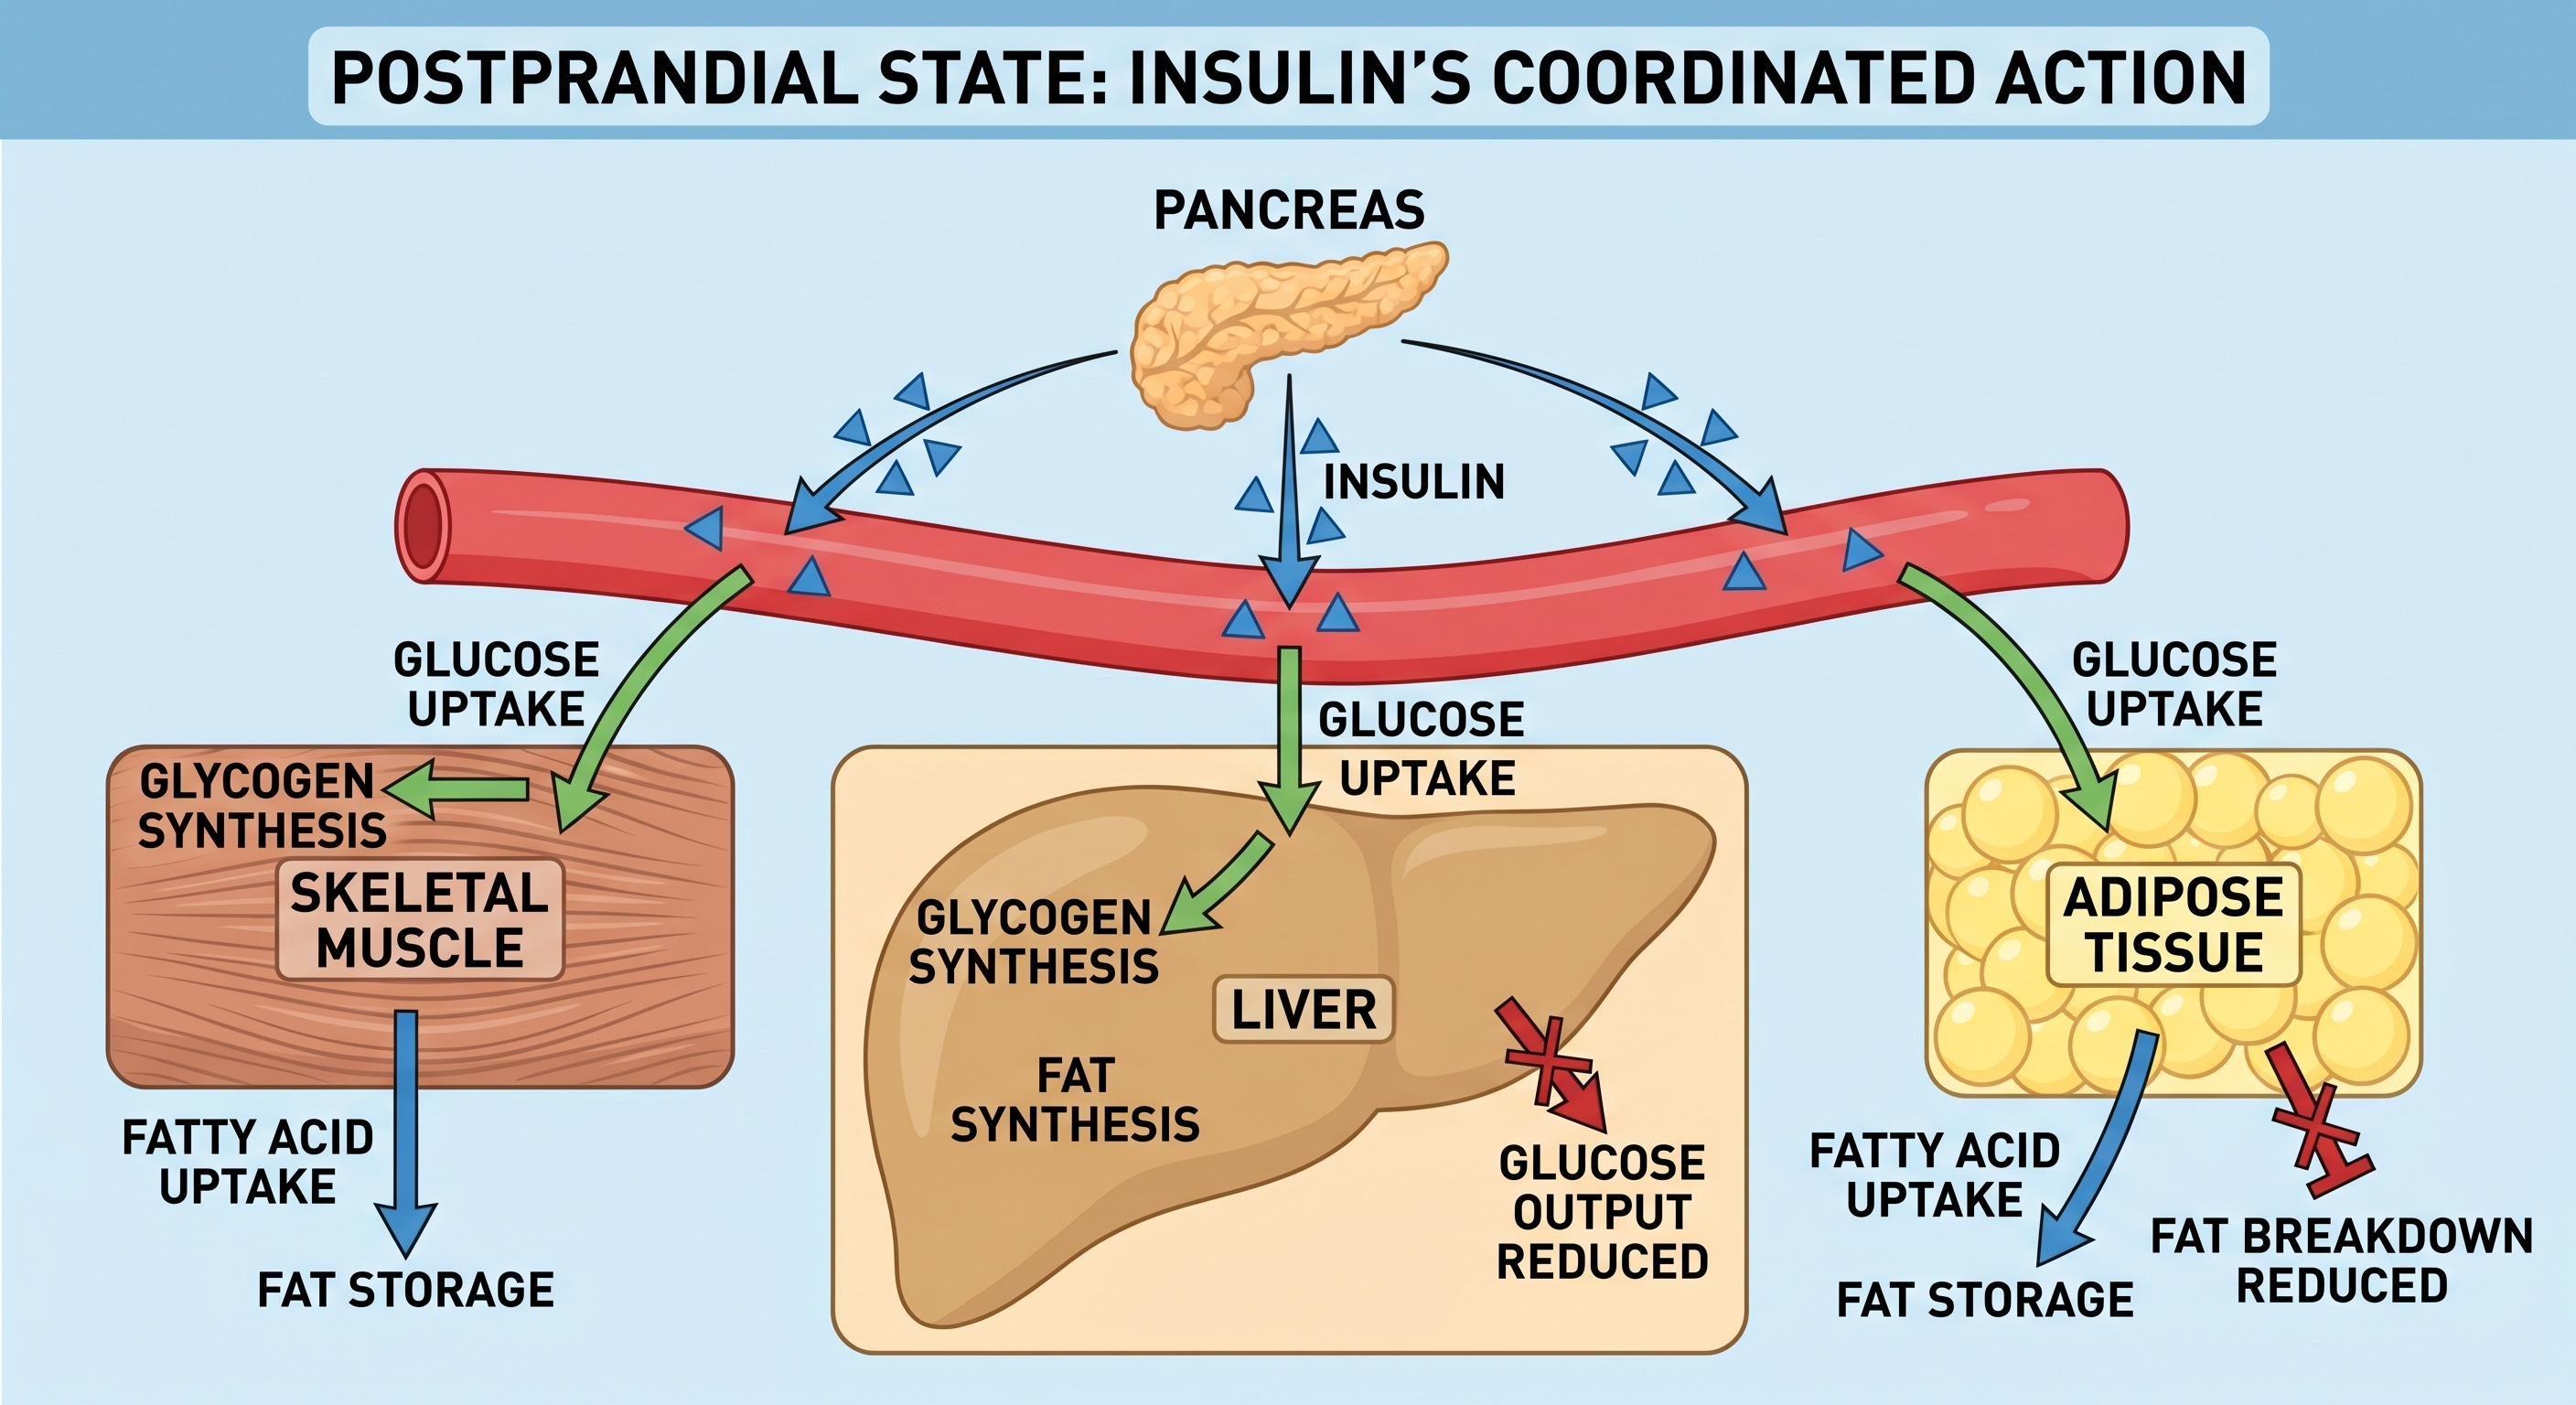
Skeletal muscle is the dominant site of postprandial glucose disposal. Under insulin stimulation, skeletal muscle takes up and stores approximately 70 to 80 percent of the glucose consumed in a meal (DeFronzo et al., Diabetes, 1981). This figure comes from landmark euglycemic clamp studies and remains the most thoroughly established number in postprandial glucose metabolism.
The liver suppresses its own endogenous glucose output in response to insulin. Between meals and overnight, the liver produces glucose through glycogenolysis, break down of hepatic glucose stores, and gluconeogenesis, metabolize new glucose mostly from fatty acids, to maintain blood glucose levels. After a meal, insulin signals the liver to stop. Failure of this suppression is a primary driver of fasting hyperglycemia in type 2 diabetes.
Adipose tissue responds to insulin by inhibiting lipolysis, the breakdown of stored triglycerides into free fatty acids, and promotes the storage of incoming dietary fat. This prevents the free fatty acid flooding that, as you will see, plays a central role in the pathological cascade.
Glucagon, cortisol, and epinephrine all oppose insulin’s effects through distinct mechanisms, raising blood glucose when it drops. The result is a finely tuned thermostat, maintaining glucose within a narrow physiological range regardless of whether you have just eaten or have been fasting for twelve hours.
If you enjoy evidence-based medical information, subscribe to receive these articles delivered to your mailbox every week.
The Molecular Relay Inside the Cell
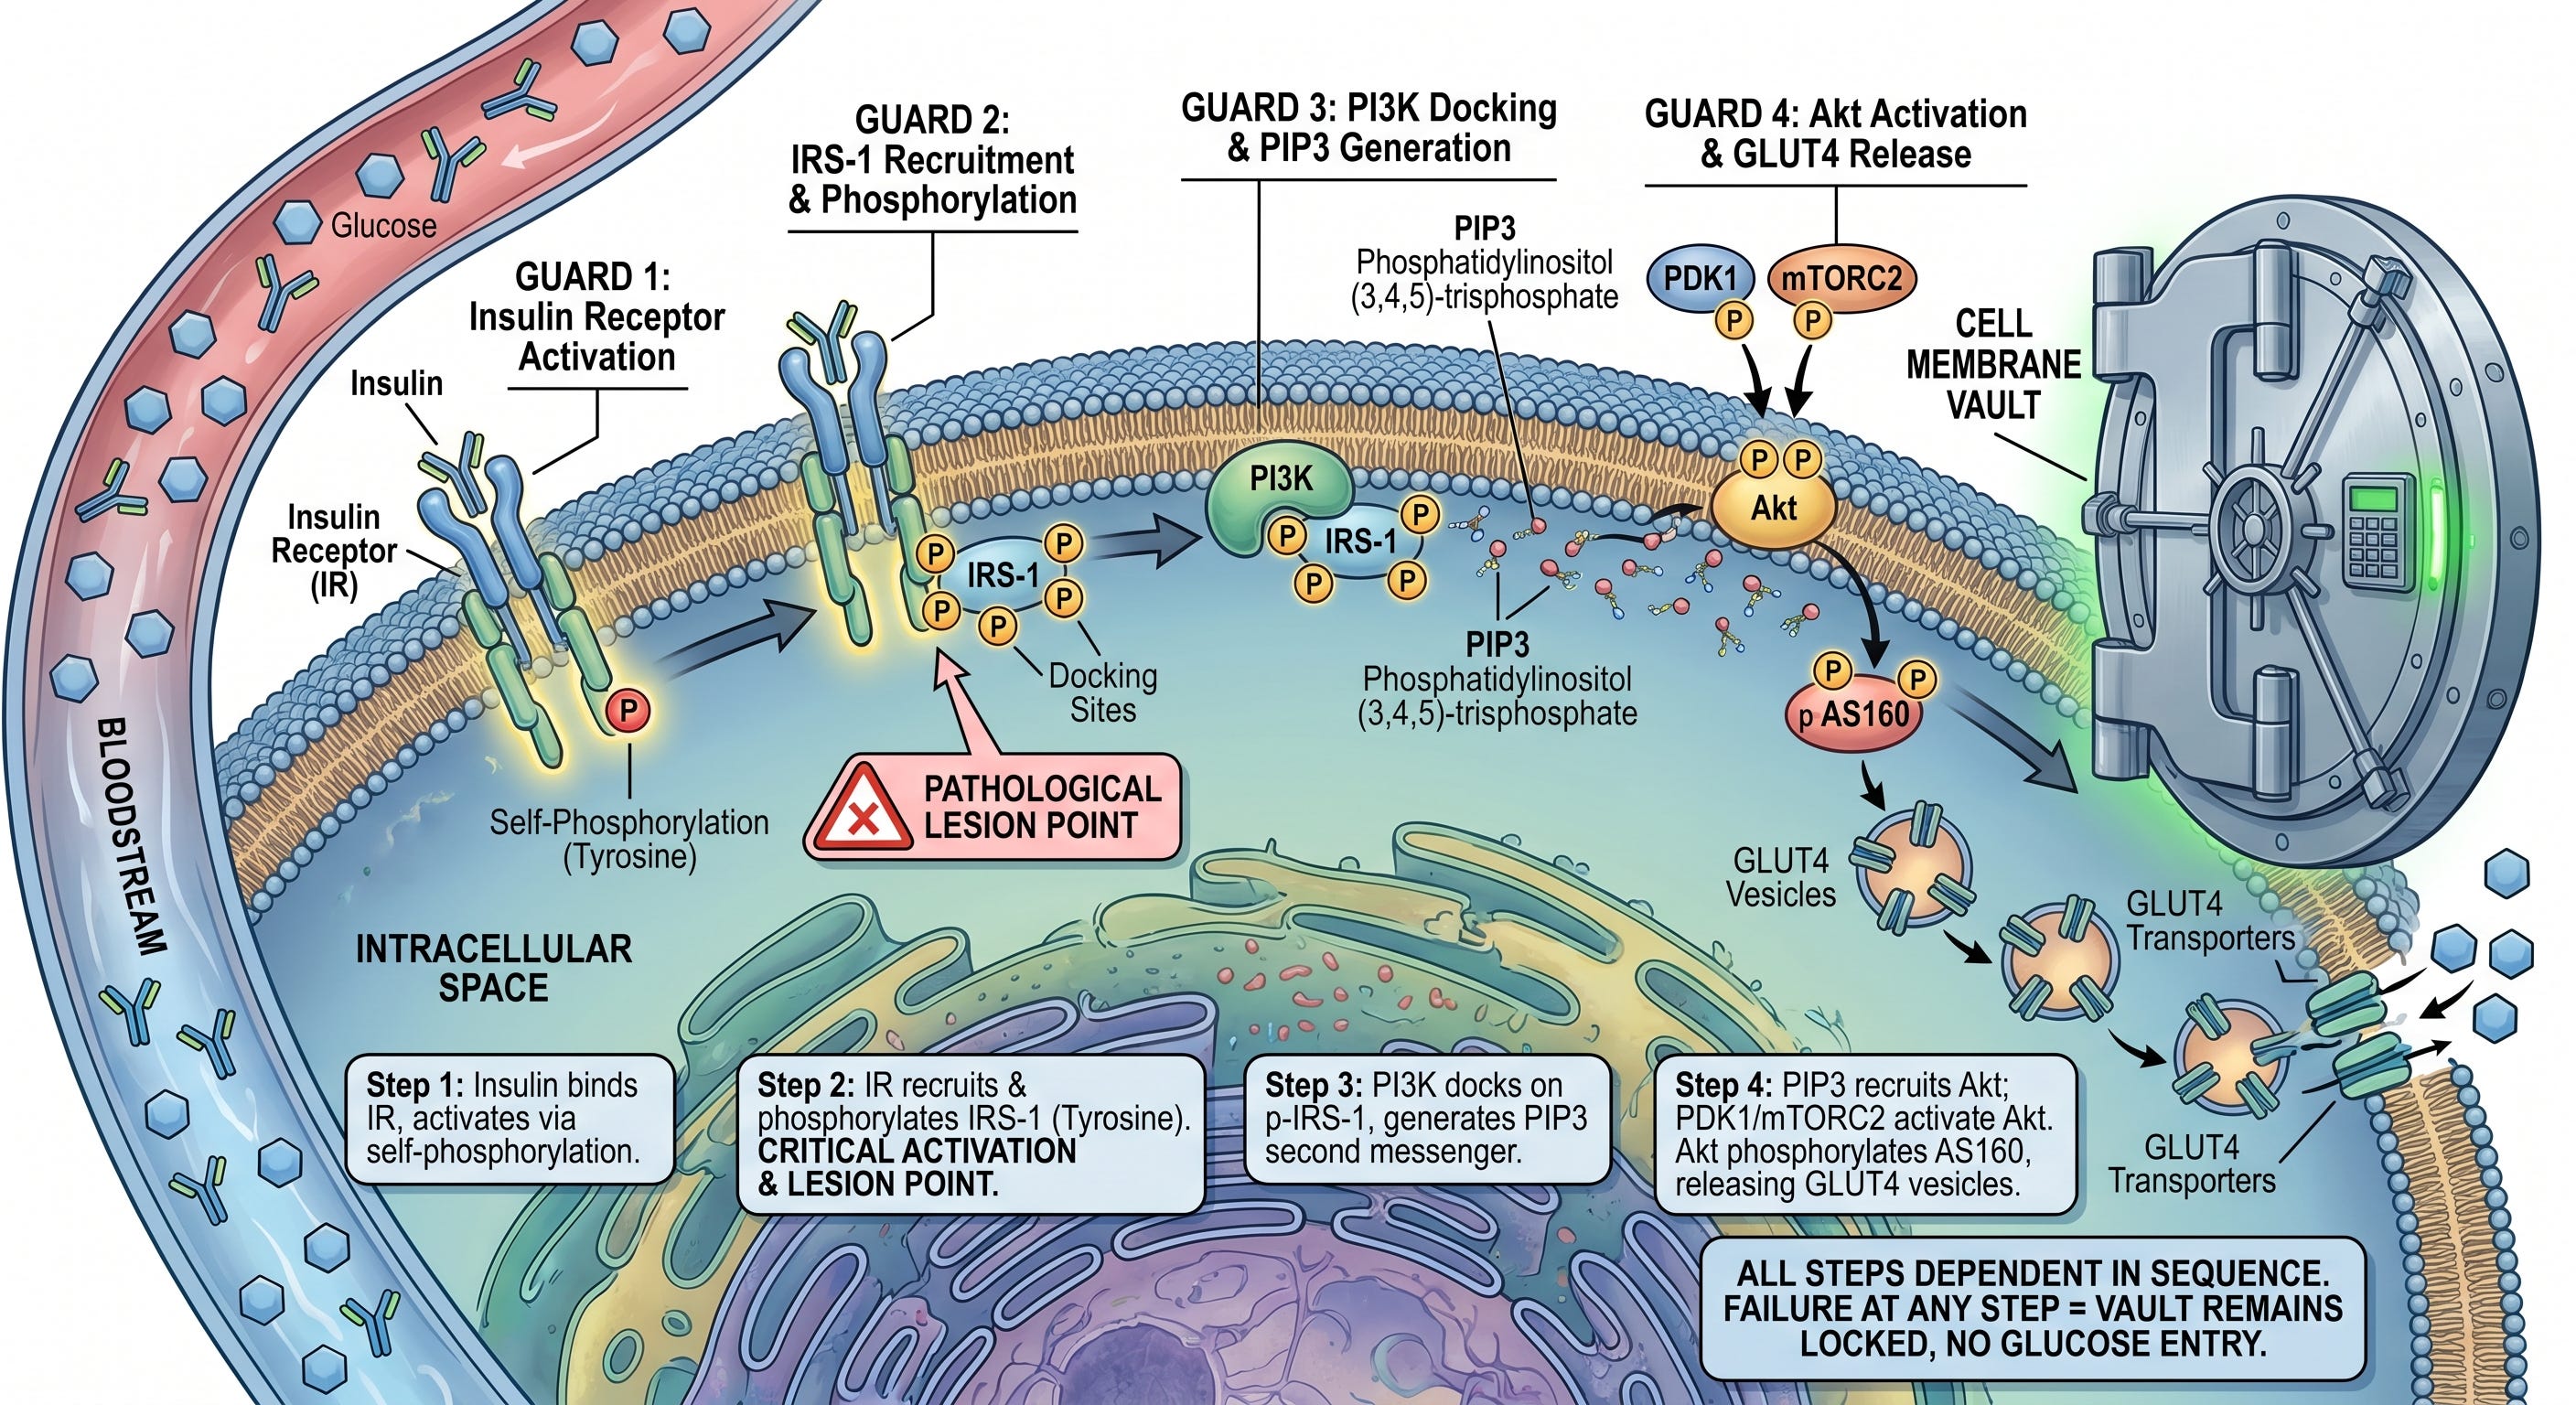
Think of glucose entry into a cell as gaining access to a high-security vault. The vault requires four guards to approve entry in sequence. Any of the steps in the sequence fails, the vault stays locked.
Here is what the four steps in the process are.
Step One: insulin in the bloodstream binds to the insulin receptor on the cell surface. The receptor is a tyrosine kinase, and activates by phosphorylating itself on tyrosine residues.
Step Two: the activated insulin receptor recruits insulin receptor substrate-1 (IRS-1) and phosphorylates it, also on tyrosine residues. This tyrosine phosphorylation is the critical activating event for the entire cascade. It creates docking sites for the next step, and is the point where the pathological lesion is introduced.
Step Three: phosphoinositide 3-kinase (PI3K) docks onto the tyrosine-phosphorylated IRS-1 and generates a lipid second messenger called PIP3. PIP3 diffuses along the inner face of the cell membrane and recruits Akt
Step Four: protein kinase B (Akt) is recruited to the membrane by PIP3 and activated there by two upstream kinases, PDK1 and mTORC2. Once active, Akt phosphorylates a protein called AS160, which releases GLUT4-containing vesicles inside the cell. Those vesicles migrate to the plasma membrane, GLUT4 transporters embed into the surface and glucose enters.
Every step in that cascade is dependent on the one before it. Failure of any step GLUT4 stays inside the cell, and glucose cannot enter despite normal or even elevated insulin concentrations in the blood.
Insulin Sensitivity Is Not a Fixed Trait
Insulin sensitivity is not a fixed biological characteristic. It is continuously variable, moving up and down in response to conditions that are largely within your influence.
A single week of sleep restriction to five hours per night reduces insulin sensitivity by approximately 25 percent in otherwise healthy subjects (Spiegel et al., Nature Reviews Endocrinology, 2009).
An episode of moderate-intensity exercise improves insulin sensitivity through an insulin-independent pathway involving AMP-activated protein kinase (AMPK), which drives GLUT4 translocation directly without requiring insulin (Richter and Hargreaves, Physiological Reviews, 2013).
Cortisol, released during psychological or physiological stress, suppresses insulin sensitivity within hours through mechanisms involving hepatic glucose production and peripheral receptor resistance.
Insulin Resistance as a Normal Biological Tool
Insulin resistance is a normal physiological process useful in specific biological contexts where redirecting fuel is necessary.
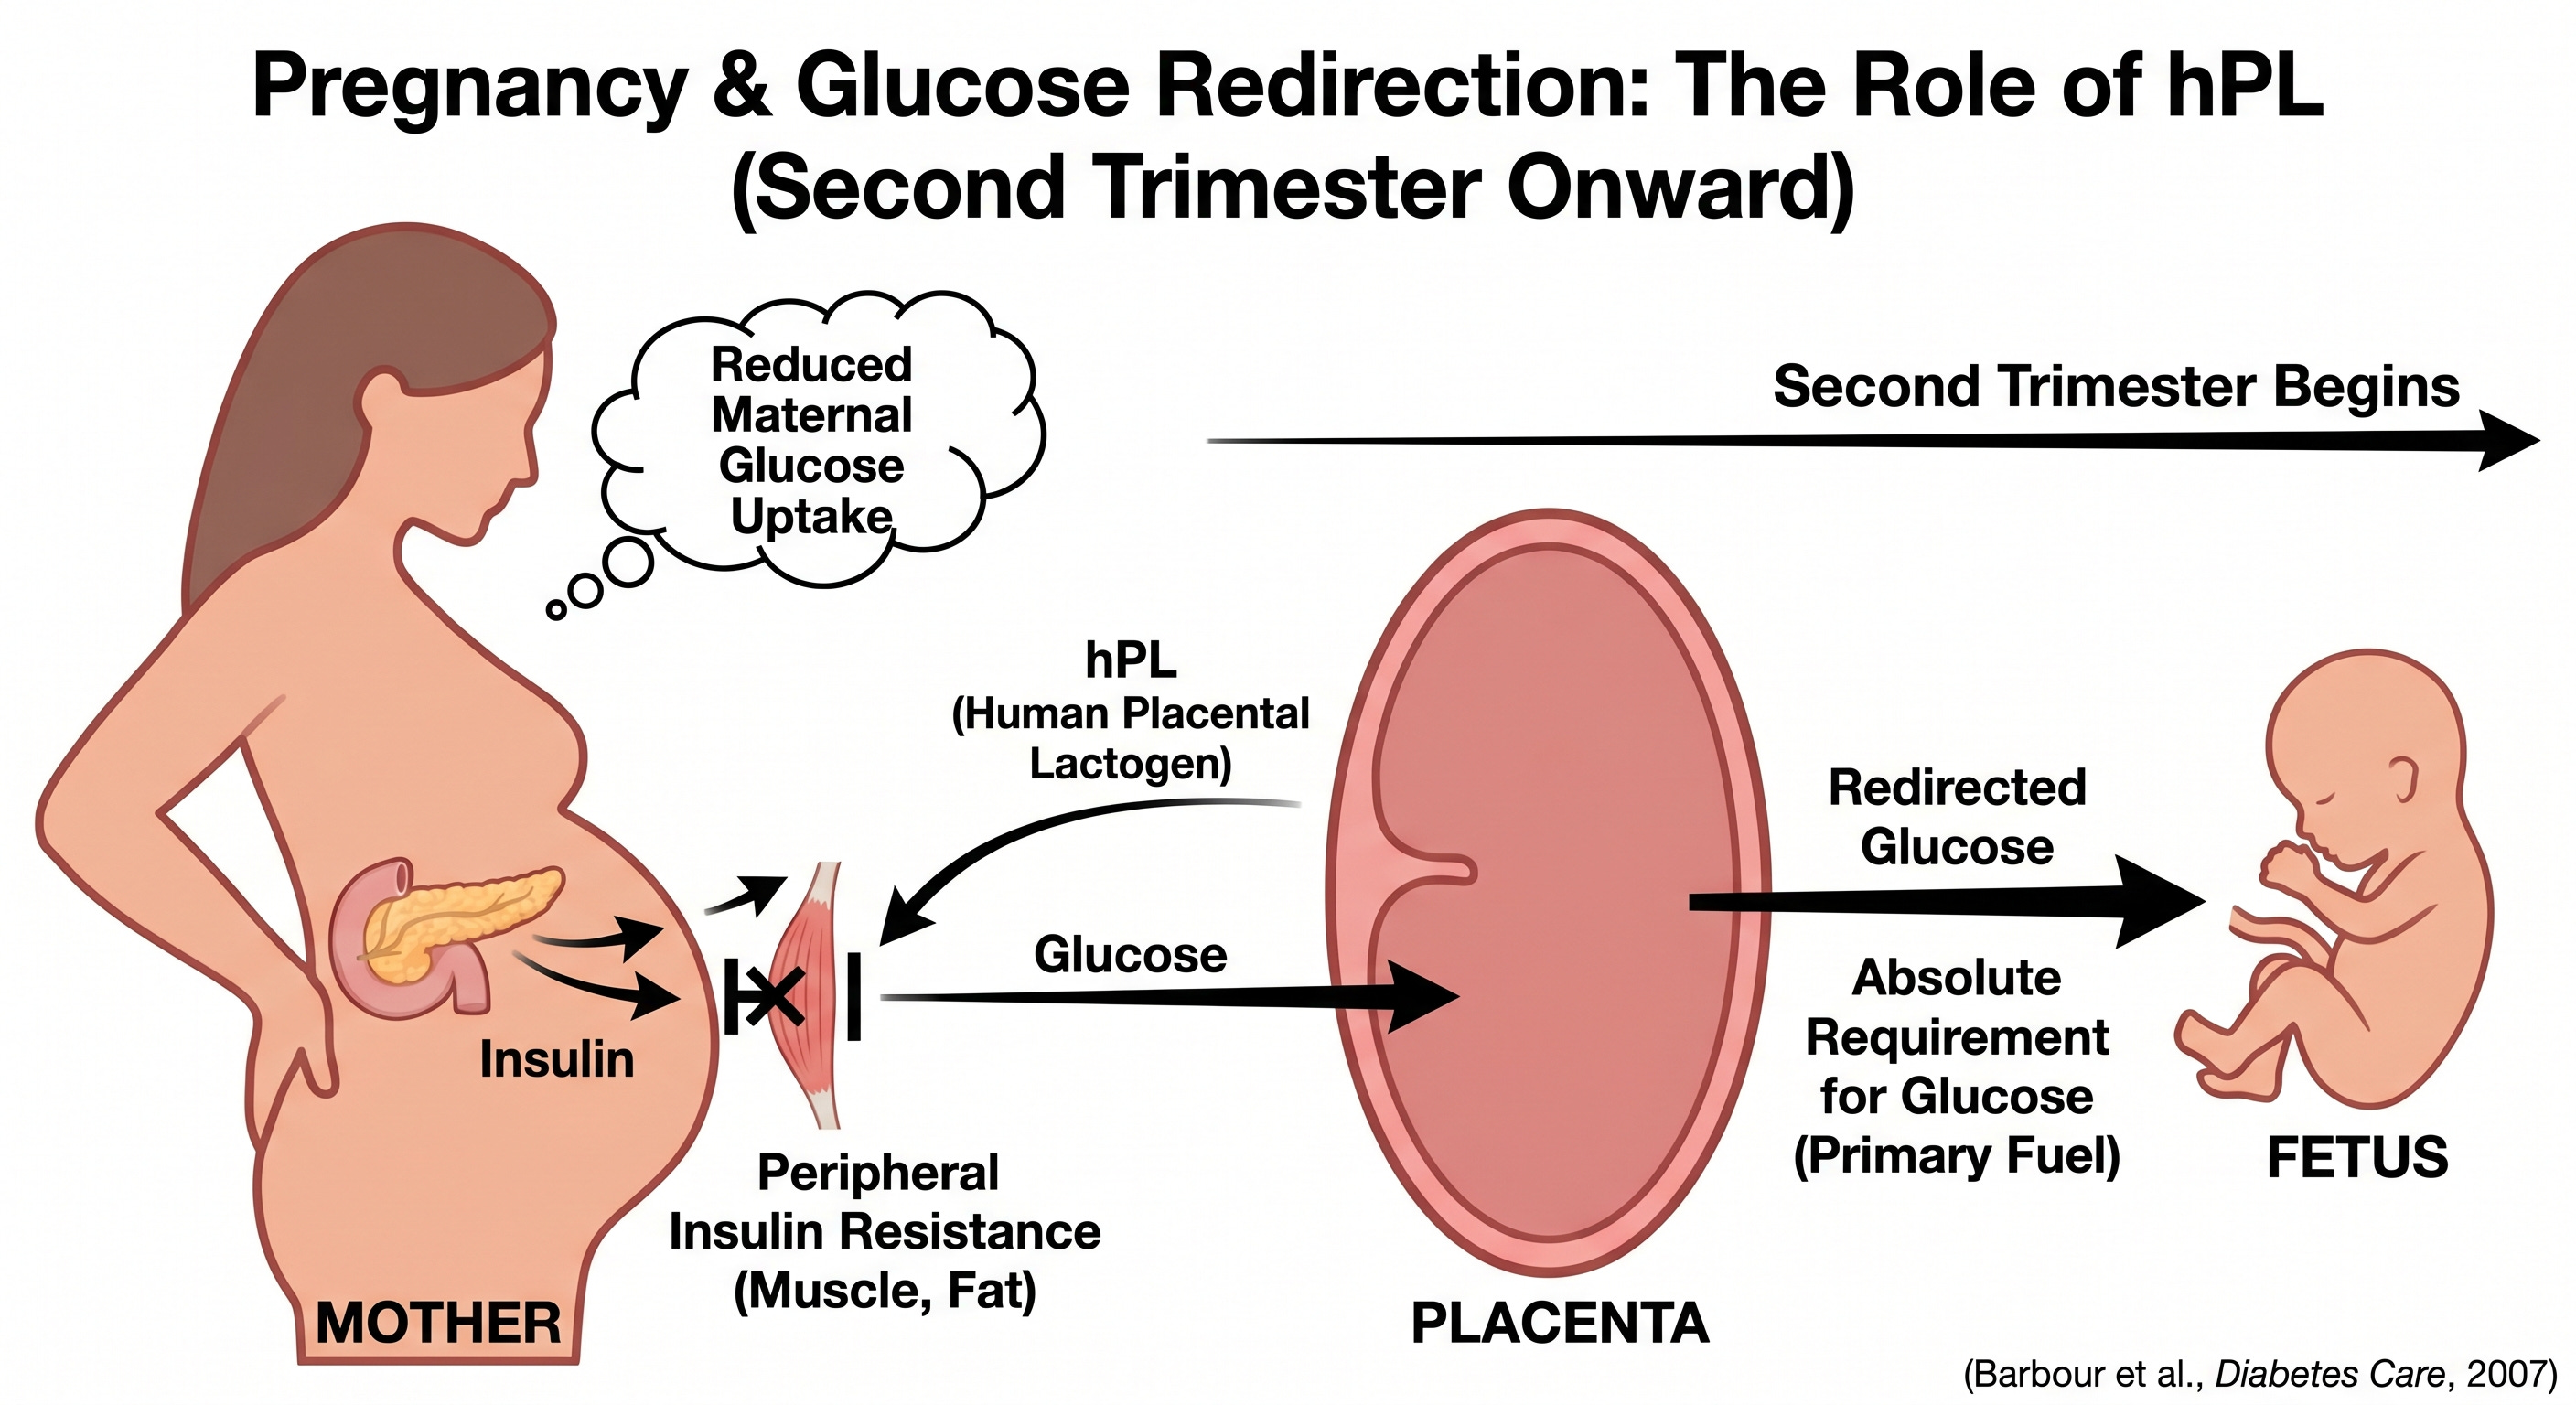
Pregnancy is a good example: beginning in the second trimester, human placental lactogen (hPL) drives a progressive state of peripheral insulin resistance in the mother. That reduces maternal glucose uptake and redirects glucose across the placenta to the developing fetus, which has an absolute requirement for glucose as its primary fuel (Barbour et al., Diabetes Care, 2007).
Similar mechanisms operate during the luteal phase of the menstrual cycle, puberty, and acute systemic illness or any context in which the body’s fuel priorities need to shift.
Where the Molecular Machinery Breaks Down
Under normal signaling, IRS-1 is phosphorylated on tyrosine residues, which activates the downstream cascade. Under pathological conditions, IRS-1 is instead phosphorylated on serine residues. Serine phosphorylation of IRS-1 acts as an inhibitory modification, blocking its interaction with PI3K and effectively stopping the cascade (White, American Journal of Physiology, 2002).
JNK (c-Jun N-terminal kinase) is activated by inflammatory cytokines and oxidative stress. IKKbeta is activated by the same cytokine milieu and by lipopolysaccharide (LPS) acting through Toll-like receptor 4 (TLR4). PKCtheta in skeletal muscle and PKCepsilon in the liver are activated by intracellular accumulation of diacylglycerols (DAG). All three kinases converge on the same target: IRS-1 serine residues.
A secondary lesion operates downstream. Ceramide accumulation, driven by saturated fatty acid excess and inflammatory signaling, directly inhibits Akt. (Summers, Progress in Lipid Research, 2006).
Molecular Pathways Driving Insulin Resistance
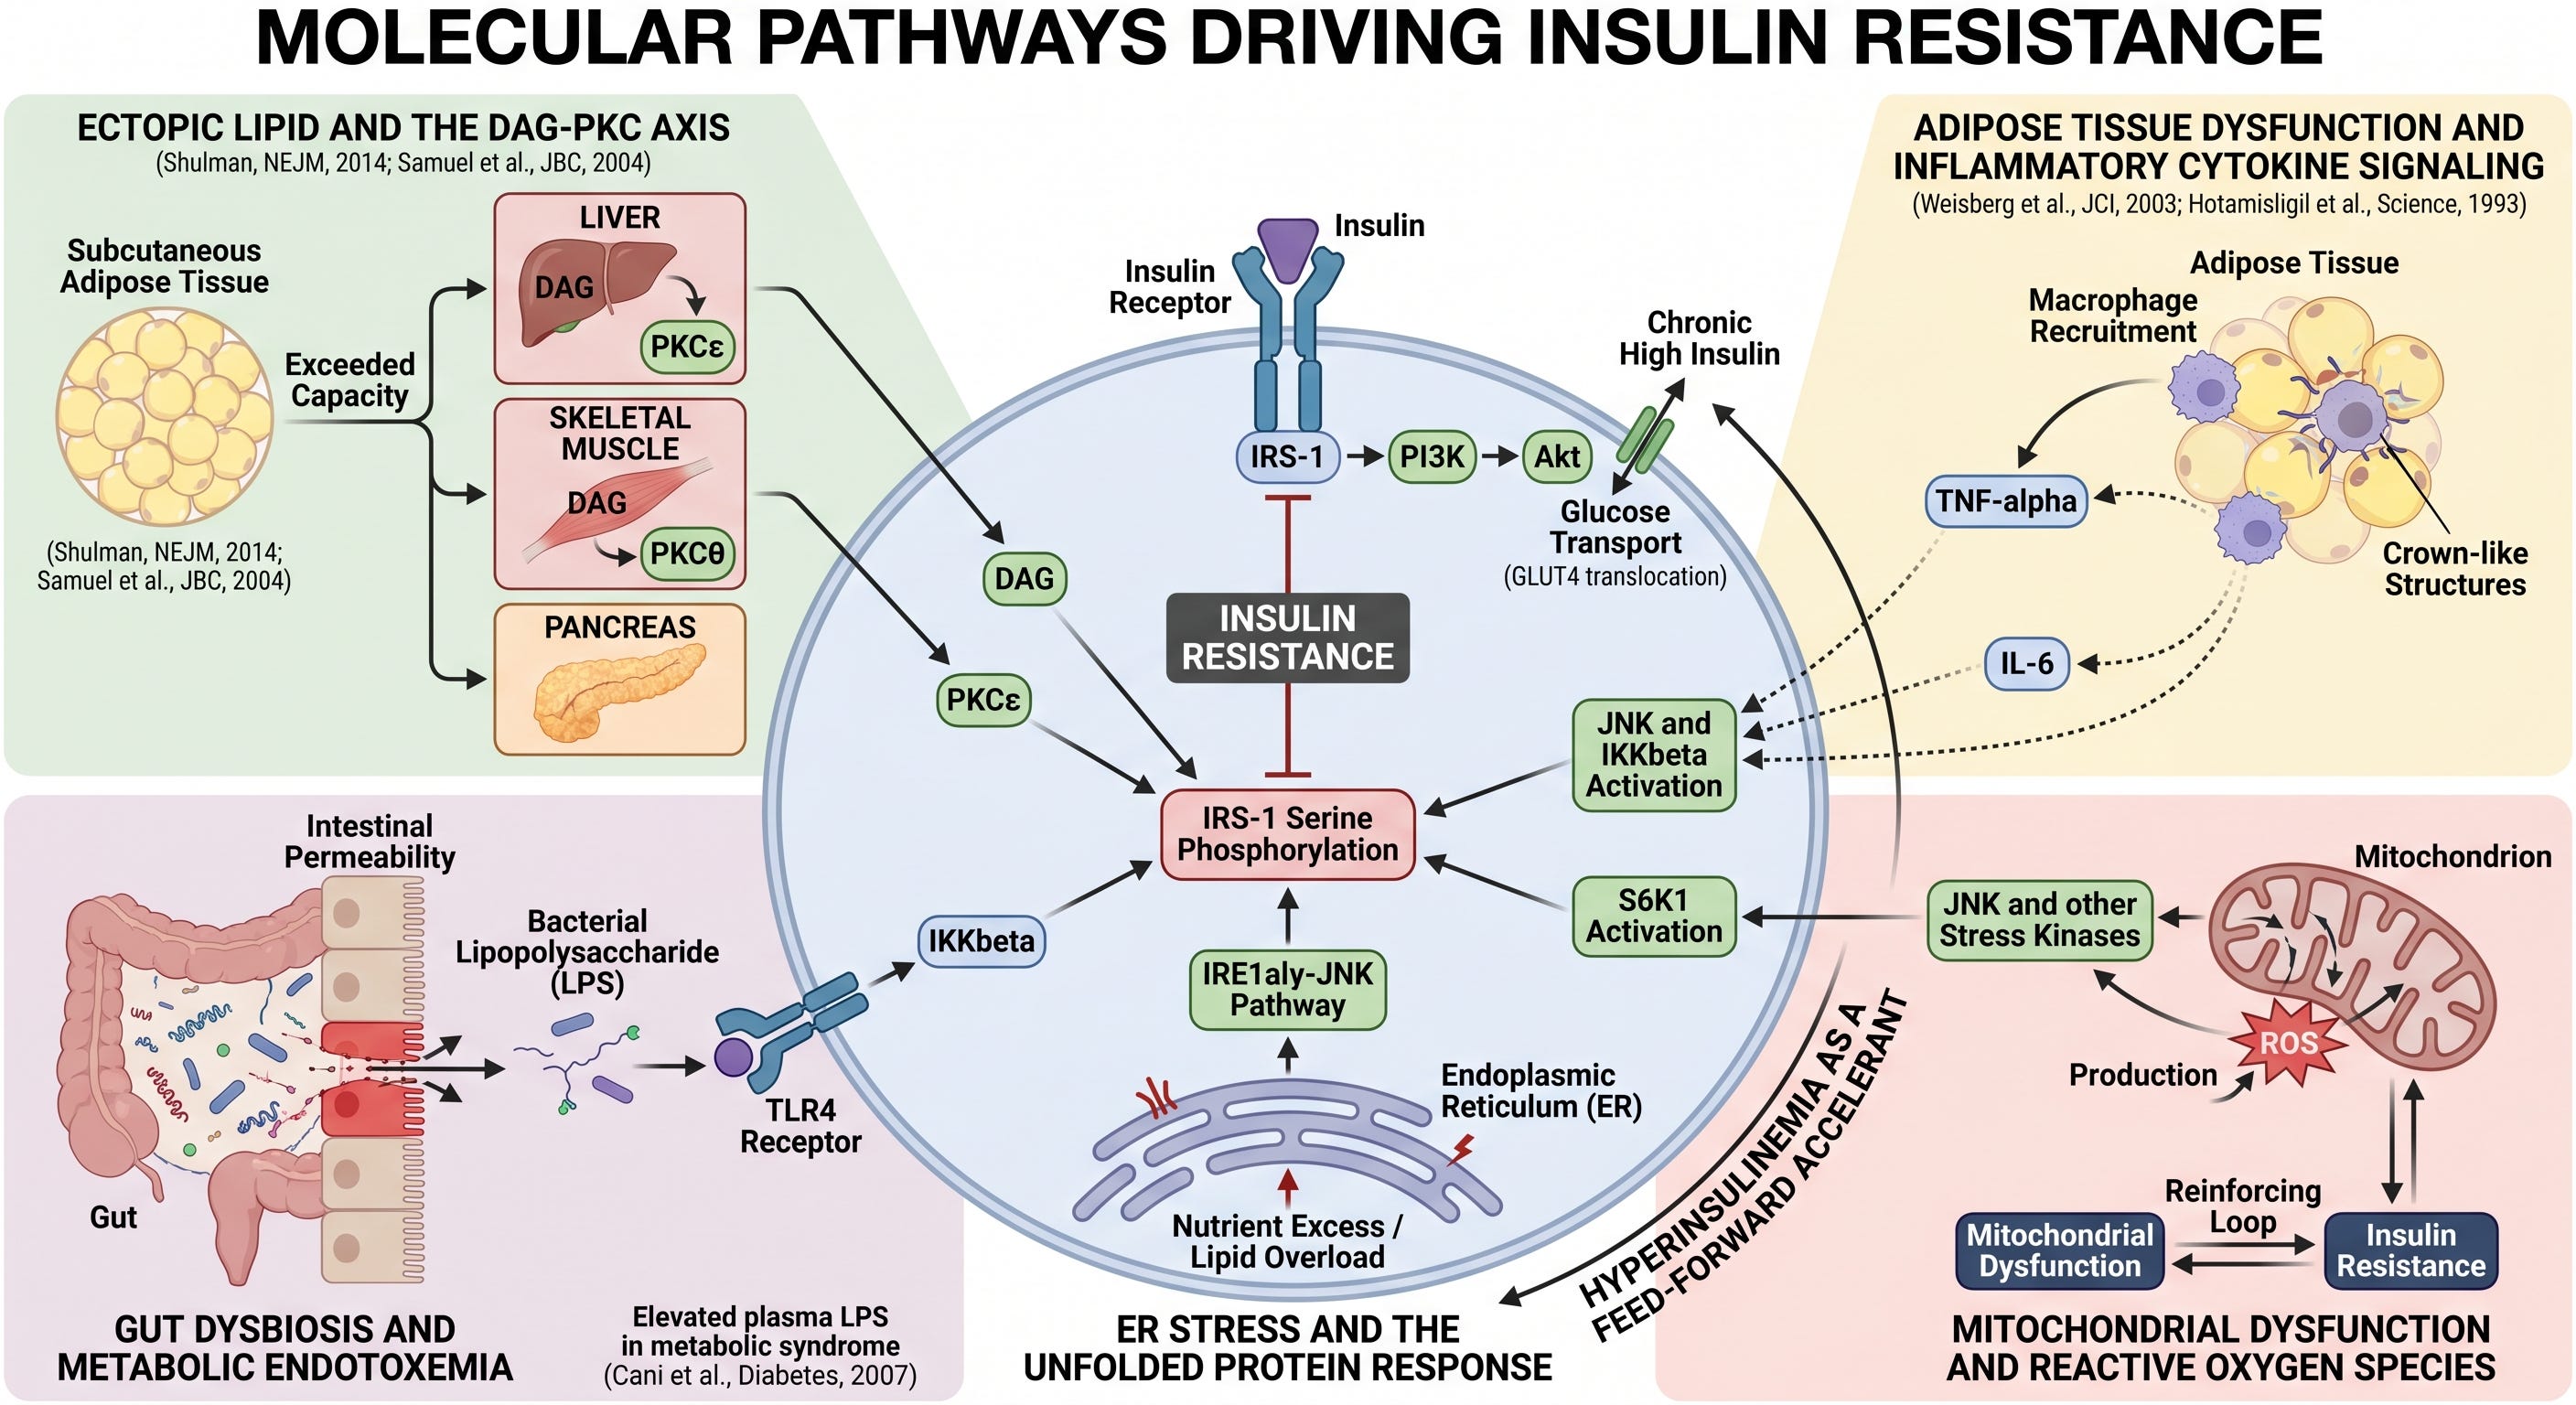
Ectopic lipid and the DAG-PKC axis. When fat storage capacity in subcutaneous adipose tissue is exceeded, lipid accumulates in tissues not designed for it: liver, skeletal muscle, and pancreas. This ectopic fat generates intracellular DAG, which activates PKCepsilon in the liver and PKCtheta in skeletal muscle, driving IRS-1 serine phosphorylation (Shulman, New England Journal of Medicine, 2014; Samuel et al., Journal of Biological Chemistry, 2004). This is the best-characterized mechanism of insulin resistance, with strong replicated evidence from both human and animal studies.
Adipose tissue dysfunction and inflammatory cytokine signaling. As adipose tissue expands beyond its functional capacity, it recruits macrophages, which form characteristic crown-like structures around dying adipocytes. These macrophages produce TNF-alpha and IL-6, inflammatory cytokines that activate JNK and IKKbeta in multiple tissues, driving IRS-1 serine phosphorylation remotely (Weisberg et al., Journal of Clinical Investigation, 2003; Hotamisligil et al., Science, 1993). This pathway is well established in both human and animal models.
Gut dysbiosis and metabolic endotoxemia. Disruption of the intestinal microbiome and increased intestinal permeability allows bacterial lipopolysaccharide (LPS) to translocate into portal and systemic circulation. LPS activates TLR4, which drives IKKbeta-mediated IRS-1 serine phosphorylation in liver and adipose tissue (Cani et al., Diabetes, 2007). The mechanistic case is compelling, and elevated plasma LPS in people with metabolic syndrome is replicated consistently. The causal relation in humans remains emerging evidence rather than established fact. The animal data are strong; the human interventional data is accumulating.
ER stress and the unfolded protein response. Nutrient excess and lipid overload trigger endoplasmic reticulum stress in metabolically active cells, activating the IRE1alpha-JNK pathway and driving IRS-1 serine phosphorylation. This mechanism is well characterized in animal models and human adipose and liver tissue, though the precise contribution relative to other pathways in humans is not fully quantified.
Mitochondrial dysfunction and reactive oxygen species. Impaired mitochondrial function increases reactive oxygen species (ROS) production, which activates JNK and other stress kinases driving the serine phosphorylation lesion. The relationship is bidirectional: insulin resistance impairs mitochondrial function, and mitochondrial dysfunction worsens insulin resistance. The causal direction has not been fully established in humans, and this pathway should be understood as a reinforcing loop rather than a clear initiating driver.
Hyperinsulinemia as a feed-forward accelerant. Chronically elevated insulin concentrations, whether driven by peripheral resistance or by continuous high-carbohydrate feeding, downregulate insulin receptor expression and activate S6K1, which independently phosphorylates IRS-1 on serine residues. This creates a self-amplifying loop: compensatory hyperinsulinemia worsens the very resistance that drove it. This is a strongly supported hypothesis with coherent mechanistic grounding, though establishing it as a primary initiating driver rather than a secondary accelerant remains an area of active investigation.
The Personal Fat Threshold
One important explanatory frameworks for understanding why metabolic risk varies so dramatically between individuals is the personal fat threshold concept, developed primarily through the work of Roy Taylor and the Newcastle group.
Every individual has a genetically and developmentally determined capacity for safe fat storage in subcutaneous adipose tissue. When that capacity is not exceeded, excess calories are stored without metabolic consequence. When it is exceeded, fat spills into ectopic sites: liver, skeletal muscle, pancreas, and pericardium. It is this ectopic deposition, not fat mass per se, that initiates the metabolic cascade.
The metabolically obese normal-weight individual carries a high total fat mass in ectopic depots because their subcutaneous storage capacity was exceeded at a relatively low absolute fat mass. The metabolically healthy obese individual carries a high absolute fat mass almost entirely in subcutaneous depots, because their storage capacity is large enough to accommodate it without ectopic spillover.
The personal fat threshold is not currently measurable with clinical tools. It cannot be determined for any individual patient. It is presented here as a strongly supported theoretical framework, not an operational clinical variable.
Research using carbon-14 dating of adipocyte DNA established that total adipocyte number stabilizes in early adulthood and does not change materially with subsequent weight gain or loss (Spalding et al., Nature, 2008). What changes is cell size. Adipocyte number is established partly during childhood, and childhood obesity drives hyperplastic adipose expansion, increasing total cell number permanently. This has direct implications for the difficulty of weight regulation in adults who were obese as children, and it has direct implications for why pediatric metabolic health matters in ways that extend decades into adulthood.
Visceral Versus Subcutaneous Fat
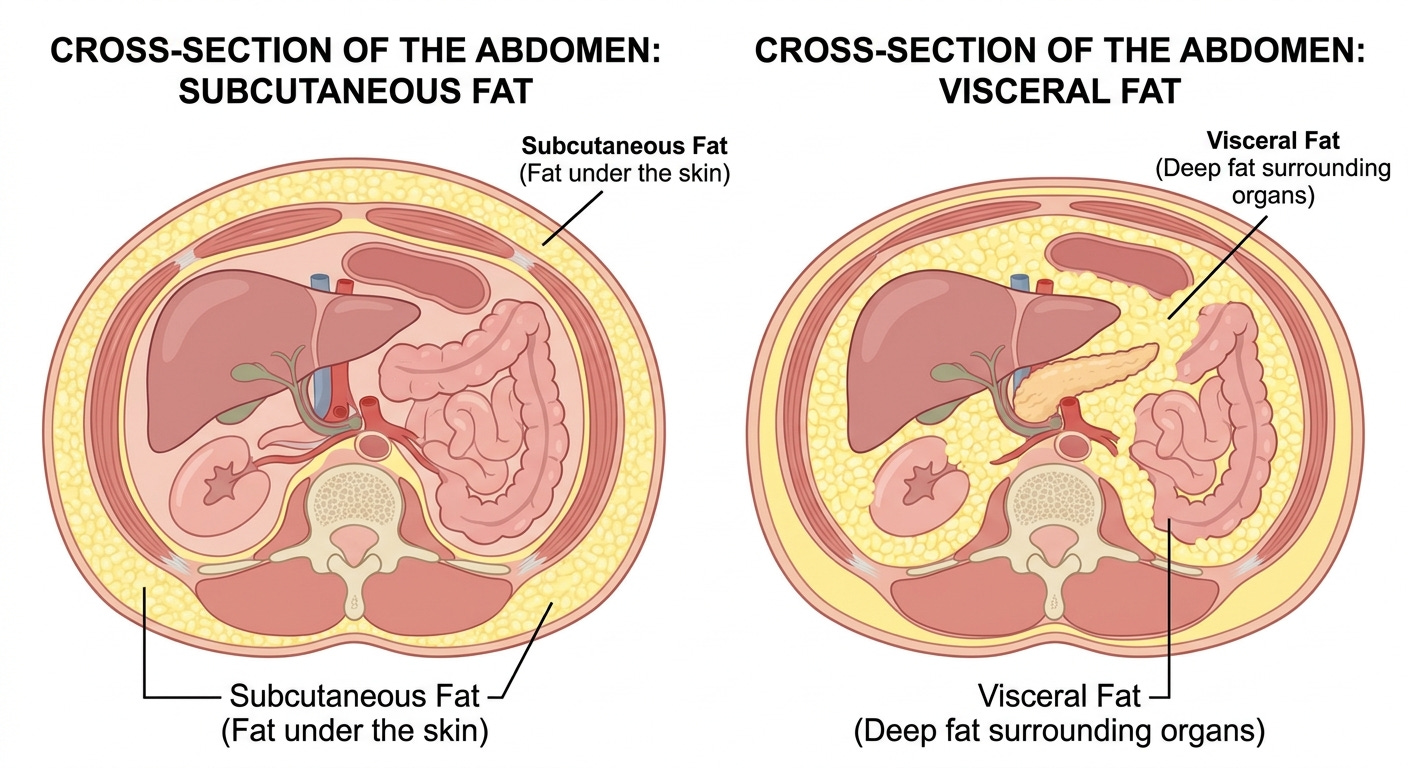
Not all adipose tissue carries the same metabolic risk. Visceral adipocytes express higher densities of glucocorticoid and androgen receptors than subcutaneous adipocytes, making them more responsive to cortisol-driven lipolysis. They are intrinsically more lipolytically active and carry greater baseline inflammatory tone. Anatomically they drain directly into the portal circulation via the portal vein, delivering their free fatty acids and inflammatory mediators directly to the liver before they reach systemic circulation. (Despres and Lemieux, Nature, 2006).
Subcutaneous fat, particularly in gluteofemoral depots, behaves differently. It is metabolically less active, less inflammatory, and anatomically positioned to drain into systemic rather than portal circulation. Research suggests that gluteofemoral fat functions as an active metabolic buffer, sequestering lipid that would otherwise enter ectopic depots. This partially explains the protective metabolic profile associated with gynoid fat distribution (pear-shape).
In women, the menopause-associated redistribution of fat from subcutaneous to visceral depots, driven by declining estrogen and relative androgenic predominance, represents a significant and often underappreciated metabolic inflection point. This androgenic fat shift and its mechanisms will be developed fully in Part Two.
Summary
By now you have a better understanding of what insulin is, what it evolved to do, how its intracellular signal propagates through a sequential molecular relay, and precisely where that relay fails in pathological insulin resistance. You understand that insulin resistance is a normal physiological tool that becomes pathological only when it cannot resolve. You understand that multiple biological pathways converge simultaneously on a single molecular lesion. You understand that individual variation in fat storage capacity determines metabolic risk independently of absolute fat mass, and that visceral and subcutaneous adipose tissue are fundamentally different in their metabolic consequences.
Part Two will show what happens when the mechanism cannot turn off: the self-sustaining loops that convert compensated insulin resistance into progressive metabolic disease, the organ-specific consequences, and the inflection points at which the clinical trajectory changes.
Found this article useful? Share your thoughts. Join the conversation below.
Educational content on The Metabolic Archives is free, because medical information should be accessible to everyone. If you find value and want to support the work, a paid subscription is available and genuinely appreciated. Visit the About Page for additional information.
The Metabolic Archives is for educational and informational purposes only, and is not intended as medical advice, diagnosis, or treatment, and does not constitute a doctor-patient relationship. Do not adopt any recommendation discussed in any article or guides published here, make changes or abandon any prescribed medical treatment without prior consultation with your physician. Always seek the advice of your physician or other qualified health provider for any questions regarding your medical condition and recommended treatment options.
By reading this post, you acknowledge that you have read and agree to the Terms of Service of The Metabolic Archives, which govern all use of this content including restrictions on reproduction.
© 2026 The Metabolic Archives. All rights reserved.
Thank you so much, Doctor, for this explanation of insulin resistance! I’m working my way through Parts 1 through 5, wishing to gain a useful understanding of how to make good dietary and lifestyle choices. So far, so good.
What a GREAT, succinct, eloquent explanation of a topic so important to understanding chronic diseases — and a topic barely touched on in that context in medical school. Bravo! I’ll be waiting for Part 2