
The Root System — A Complete Guide to Insulin Resistance
Part Two: When Insulin Resistance Becomes a Disease


The Invisible Phase
When peripheral tissues begin resisting insulin’s signal, the pancreatic beta cells respond by producing more insulin. Your fasting glucose is normal, HbA1c is reassuring, your doctor review the numbers with you; everything looks fine. And yet something is wrong. You feel it, your waistline shows it, your energy contradicts it. The pancreas is already working at supra-physiological levels to hold those number in place.
You are not imagining things!
That gap between what routine tests detect and what is actually happening in your body is one of the most consequential blind spots in modern preventive medicine. You may be years into a progressive metabolic deterioration that standard screening cannot see.
The Diagnostic Gap
HbA1c reflects average glucose over the preceding 90 days. Aftermeal glucose spikes, the earliest detectable form of glucose dysregulation, are diluted into the average and disappear. The test is also unreliable in condition affecting red cell lifespan: hemolytic anemia, iron deficiency anemia, hemoglobinopathies including sickle cell trait. In these patients, HbA1c can be systematically misleading in either direction. As Gallagher et al. noted in the Journal of Diabetes (2009), HbA1c has well-documented limitations as an early detection tool, particularly for capturing postprandial dysregulation.

Fasting glucose is a late-stage marker. By the time fasting glucose climbs above the diagnostic threshold, a significant portion of beta cell functional reserve is already lost. Fasting glucose turning diagnostic means the most reversible window for insulin resistance has already passed.
The actual tool that captures what these two miss is the 2-hour oral glucose tolerance test (OGTT). By measuring glucose response at two hours after a standardized 75-gram carbohydrate load, the OGTT detects impaired glucose tolerance today, not years in the future. The DECODE Study Group (2001), analyzing data across European cohorts, demonstrated that 2-hour post-load glucose was a stronger predictor of cardiovascular mortality than fasting glucose. The OGTT fell out of routine clinical use for practical reasons: it requires a two-hour patient visit, careful standardization, and coordination that a fasting blood draw does not.
The implication for you: have you have been screened with the right tool. For early metabolic dysfunction detection, OGTT is the right tool.
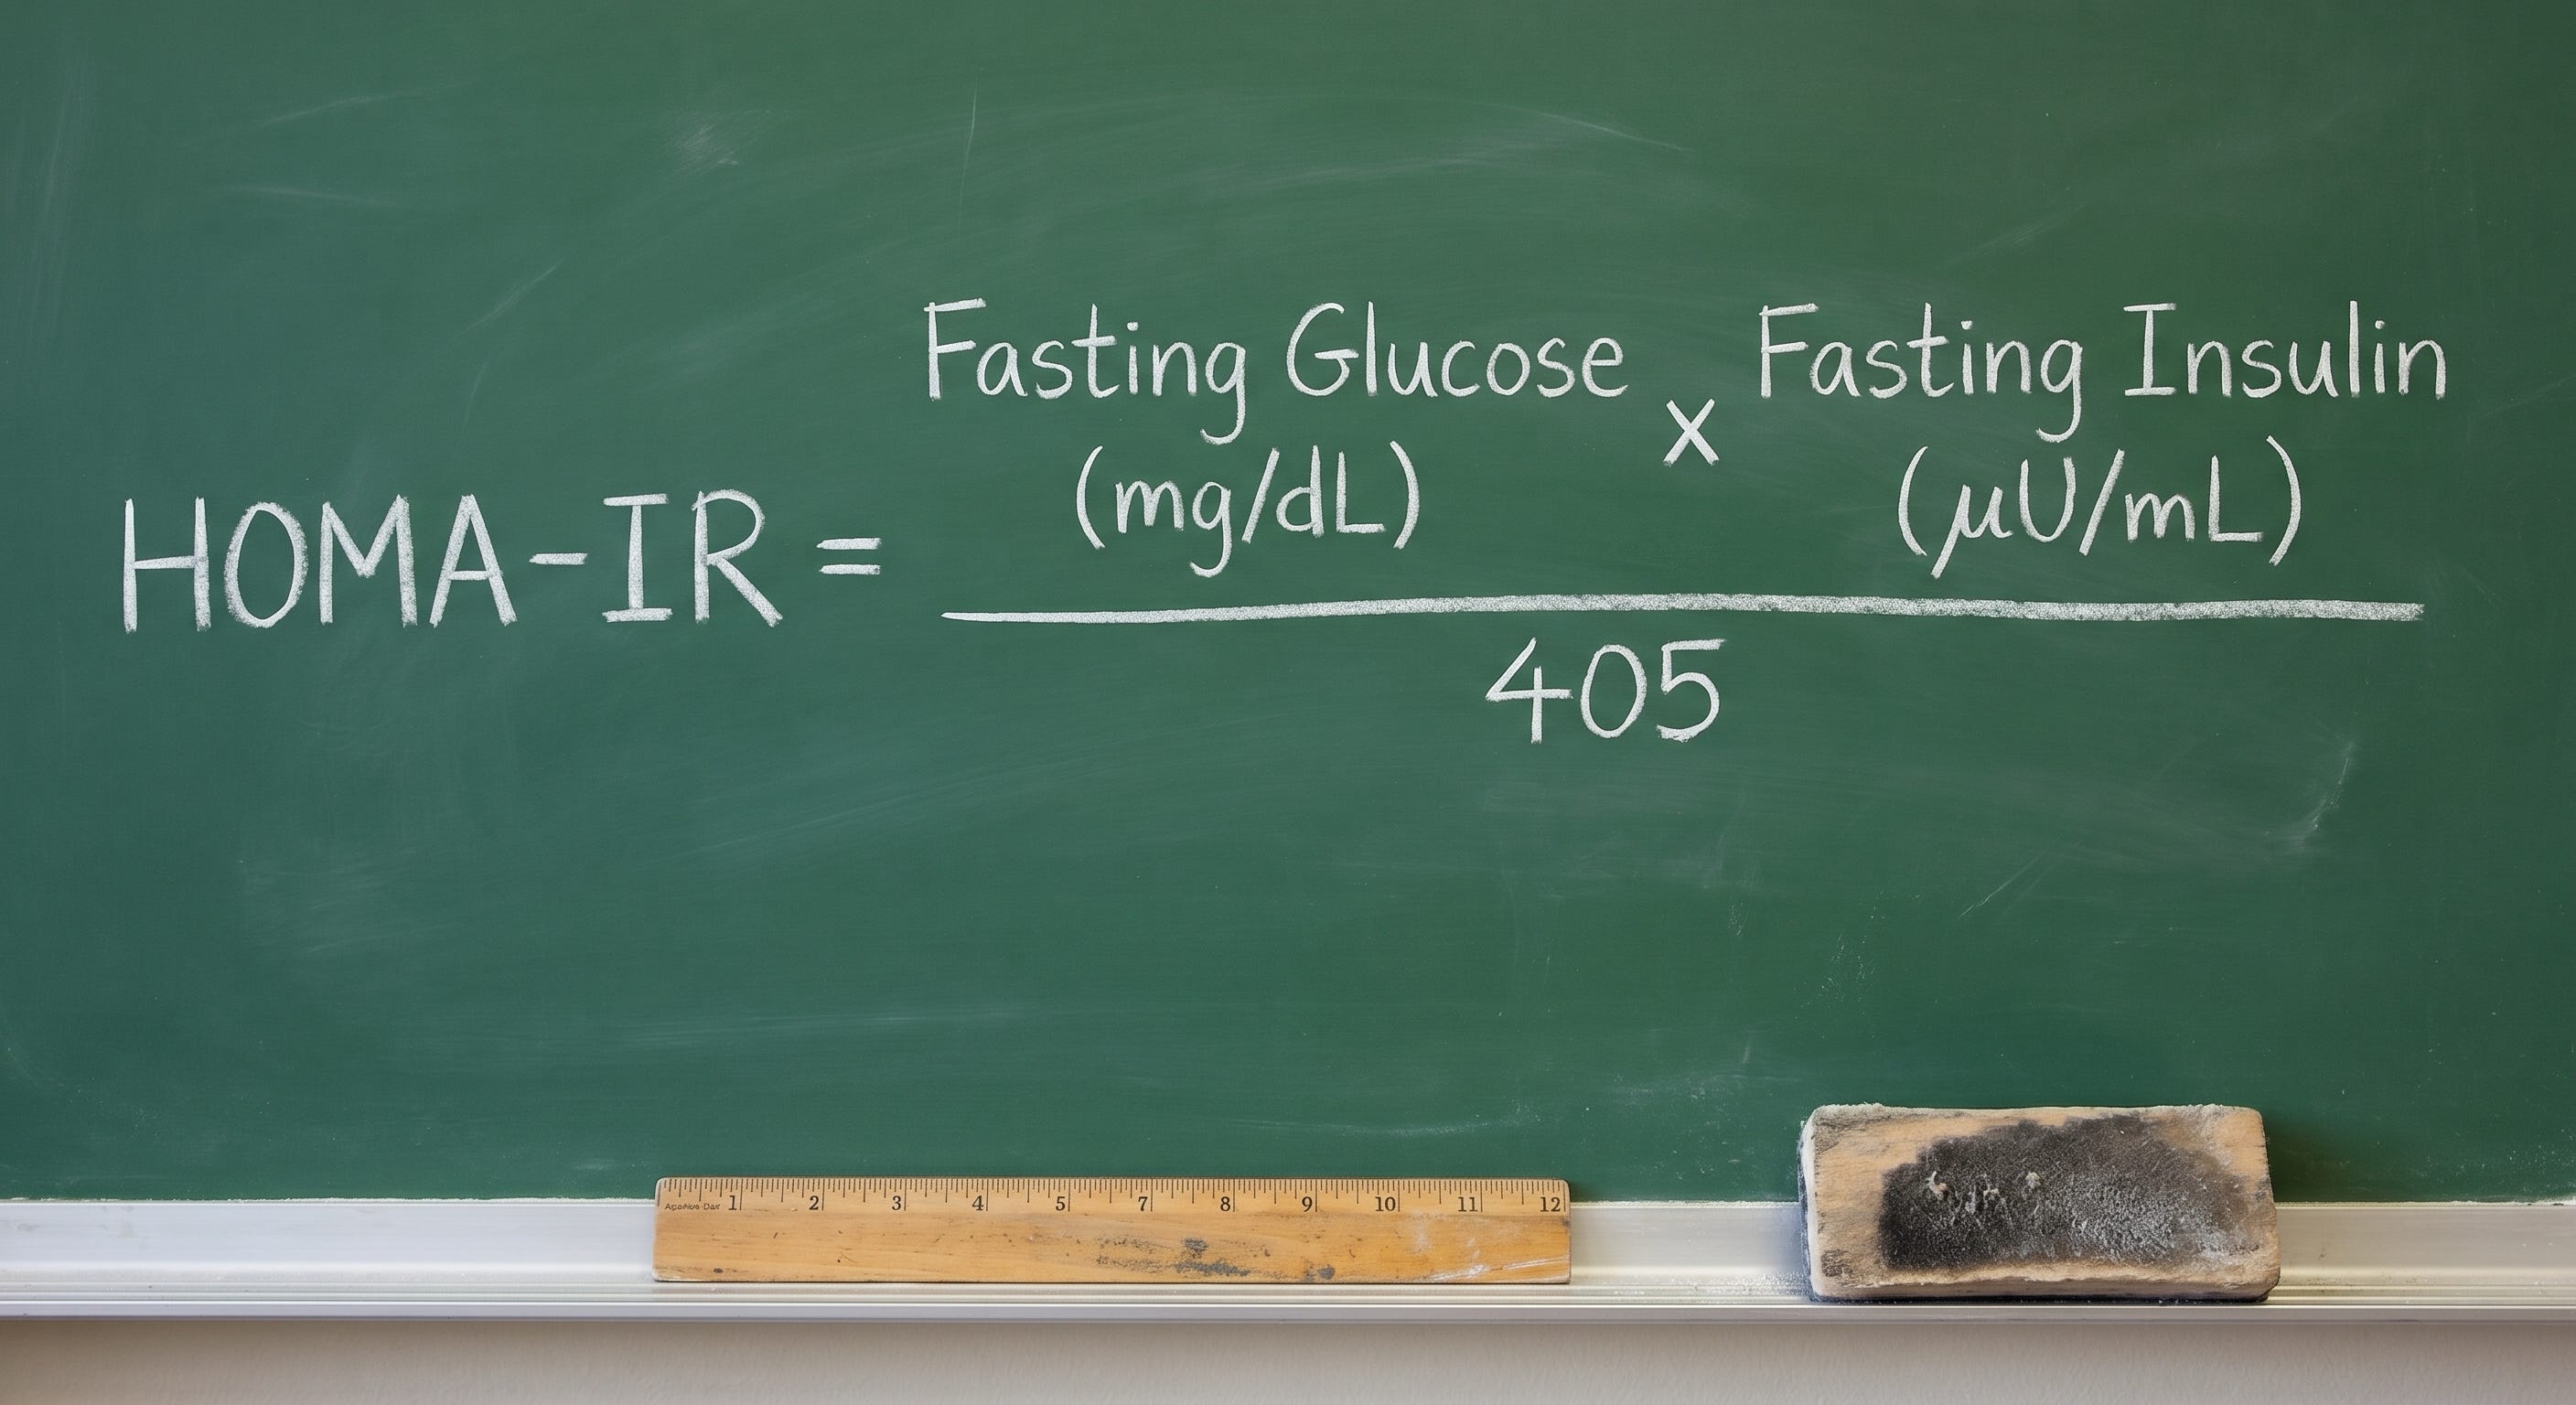
HOMA-IR Another Useful Tool
A calculated tool available from standard lab values is HOMA-IR (Homeostasis Model Assessment of Insulin Resistance): fasting glucose (mg/dL) multiplied by fasting insulin (µIU/mL), divided by 405. Validated against the euglycemic hyperinsulinemic clamp as reference standard by Matthews et al. in Diabetologia (1985), HOMA-IR provides an estimate of hepatic insulin resistance from two routine values. Its limitation is that it captures only the fasting, hepatic component of resistance missing peripheral postprandial dysregulation. Its utility is also constrained by the lack of standardized insulin assays across laboratories and population-specific threshold variation.
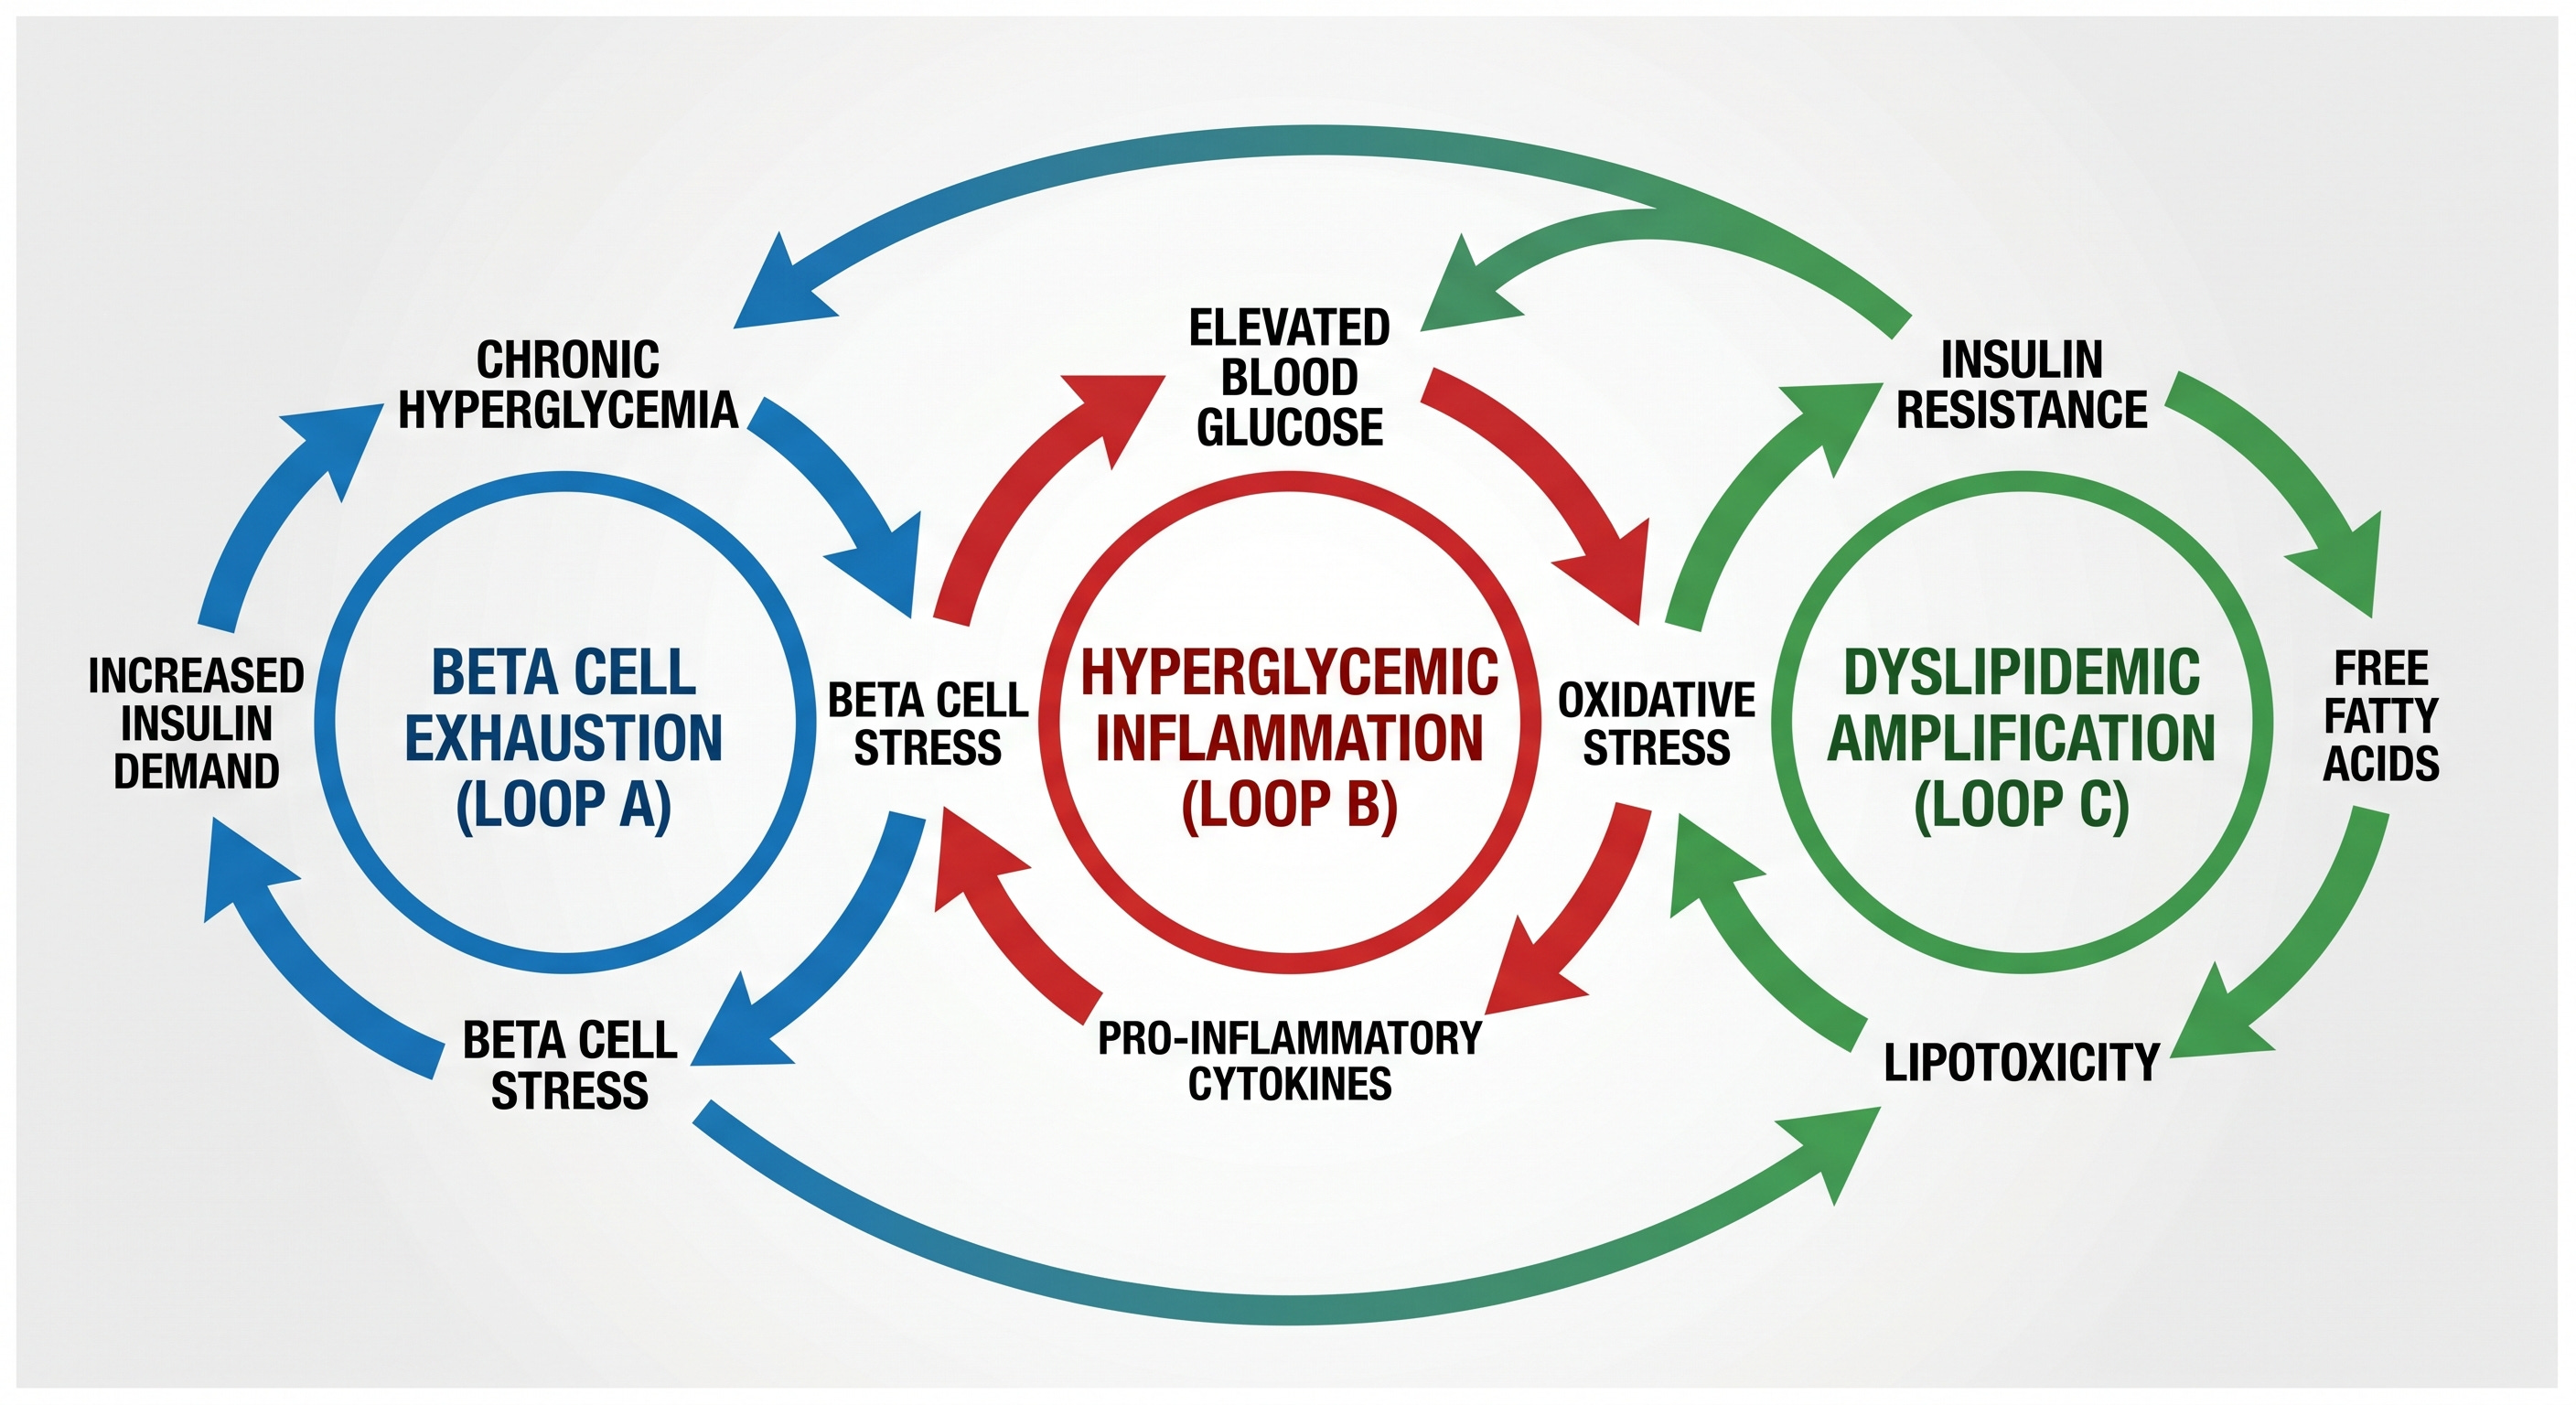
The Self-Sustaining Loops
Loop One: Pancreatic Compensation and Beta Cell Failure
Compensatory hyperinsulinemia is initially effective, but the beta cell paying for that effectiveness is operating at supra-physiological secretory output in an environment of chronic low-grade inflammation, elevated free fatty acids (FFAs), and progressive glucose toxicity. That environment is not sustainable indefinitely.
Glucolipotoxicity is the specific combined toxicity from chronic exposure of beta cells to glucose elevation and free-fatty acids (FFA). As Poitout and Robertson demonstrated in Endocrine Reviews (2008), neither insult alone produces the same degree of damage as their combination. Glucose toxicity impairs insulin gene expression and secretory function. FFA toxicity, through ceramide accumulation and mitochondrial uncoupling, drives beta cell loss (apoptosis). Together, they produce a rate of beta cell loss that neither would generate independently.
When adipose tissue reaches its fat threshold, genetically determined storage limit, fat begins depositing in non-adipose organs, including the pancreas. Taylor’s twin cycle hypothesis, developed and tested through the DiRECT trial and subsequent work published in Cell Metabolism (2018), established that intra-pancreatic fat accumulation is linked to beta cell dysfunction, and significant caloric restriction can restore meaningful beta cell function in earlier-stage disease. The operative word is remission, not reversal. Beta cell function can be recovered. Beta cell mass, once lost, cannot be meaningfully regenerated with current therapeutic tools.
Chronically hyperstimulated beta cells overproduce islet amyloid polypeptide (IAPP), which misfolds and aggregates into amyloid deposits within the islet architecture. As reviewed by Westermark et al. in Physiological Reviews (2011), this deposition is directly toxic to beta cells and disrupts the cellular organization of the islet, impairing both insulin secretion and local paracrine signaling.
Take away point: insulin resistance reversibility window is real and achievable with aggressive lifestyle modification. Reversibility is more successful with early rather than late interventions; early and accurate diagnosis with OGTT is your best option.
If you enjoy evidence-based medical information, subscribe to receive these articles delivered to your mailbox every week.
Loop Two: Hyperglycemia as Inflammatory Driver
Advanced glycation end products (AGEs) form when glucose binds non-enzymatically to proteins and lipids in a concentration-dependent process. AGEs accumulate in vessel walls, lens, kidney, and nerve tissue, and activate the receptor for AGEs (RAGE). RAGE activation drives NF-κB, the master inflammatory transcription factor, generating endothelial dysfunction, vascular stiffening, and sustained pro-inflammatory cytokine output. Brownlee’s foundational synthesis in Diabetes (2005) unified these pathways under a single mechanistic framework: mitochondrial superoxide overproduction under glucose excess as the upstream driver of all major pathways of diabetic complication.
HbA1c is an early form of AGE, and is usually normal in early stages of metabolic dysfunction, rising along as the metabolic dysfunction progresses with time.
The polyol pathway operates in parallel. In insulin-independent tissues, nerves, retinal cells, kidney, excess glucose is reduced to sorbitol by aldose reductase, consuming NADPH in the process. NADPH depletion impairs glutathione regeneration, reducing the cell’s primary antioxidant defense. Osmotic stress from sorbitol accumulation compounds the damage.
As detailed by Brownlee in Nature (2001), this pathway is a primary contributor to the microvascular and neuropathic complications of chronic elevated glucose.
Loop Three: Dyslipidemia as Amplifier
Insulin normally suppresses hepatic very-low density lipoprotein (VLDL) secretion and upregulates lipoprotein lipase-mediated VLDL clearance. When the liver becomes insulin resistant, both arms fail: VLDL secretion increases through uninhibited de novo lipogenesis, and clearance falls; blood triglycerides then rise. The triglyceride-enriched environment drives CETP-mediated exchange of triglycerides into high-density lipoprotein (HDL) particles, which are then rapidly cleared, reducing HDL. Hepatic lipase acts on the resulting triglyceride-enriched low-density lipoproteins (LDL), producing the small, dense, highly atherogenic LDL particles. And so, the classical lipid pattern of insulin resistance — elevated triglycerides, reduced HDL, small dense LDL — takes hold.
As detailed by Taskinen and Borén in Atherosclerosis (2015), this entire lipid architecture is a coherent downstream consequence of insulin resistance acting at the hepatic level.
The HPA Axis, Cortisol, and Sleep
Cortisol, the primary glucocorticoid output of the HPA axis, impairs insulin signaling at multiple points simultaneously. It inhibits PI3K, the kinase immediately downstream of the insulin receptor that initiates the GLUT4 translocation cascade. It directly suppresses GLUT4 expression in skeletal muscle, reducing the primary site of insulin-stimulated glucose disposal. It potentiates hepatic glucose output through upregulation of PEPCK and glucose-6-phosphatase, the rate-limiting enzymes of gluconeogenesis. As established by Rizza, Mandarino, and Gerich in the Journal of Clinical Endocrinology and Metabolism (1982) and further characterized by Andrews and Walker in Clinical Science (1999), cortisol-induced insulin resistance operates through a postreceptor defect, the insulin receptor itself may bind normally while the downstream signal fails.
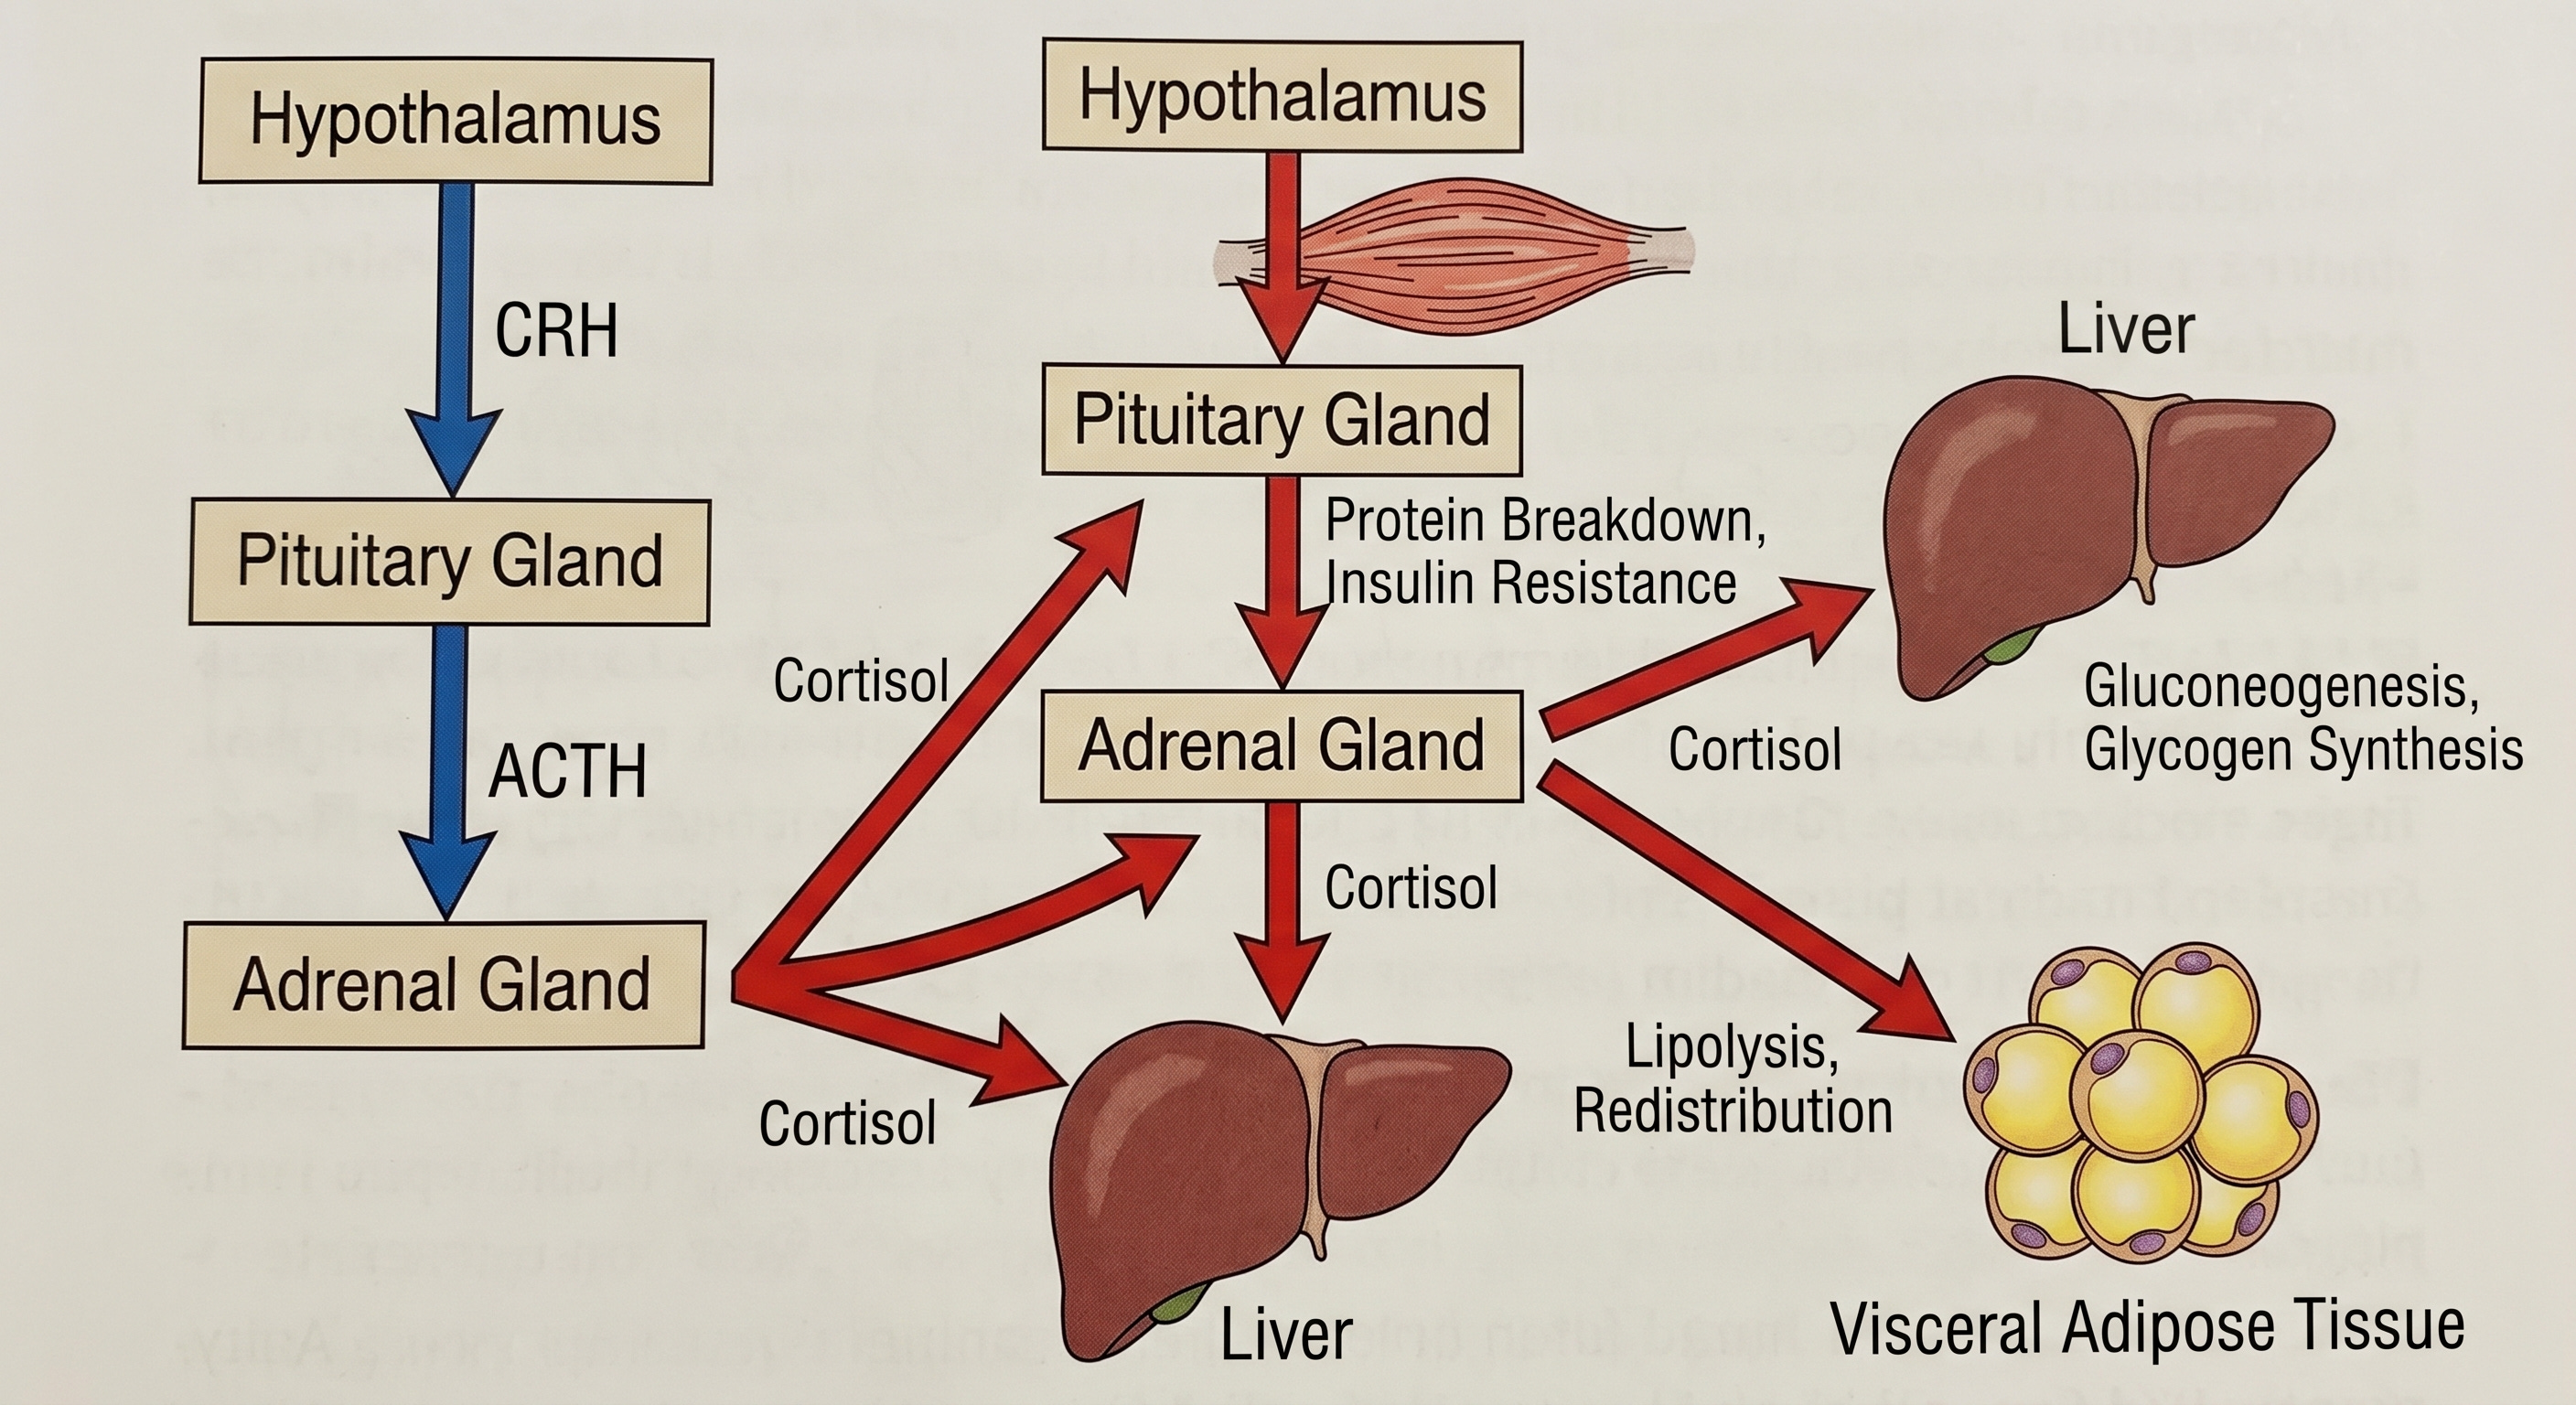
Cortisol also actively remodels fat distribution. Visceral adipocytes express a higher density of glucocorticoid receptors than subcutaneous adipocytes. Chronic cortisol elevation preferentially drives fat deposition into the visceral depot. Björntorp’s analysis in Obesity Reviews (2001) established the mechanistic and epidemiological case for HPA axis hyperactivation as a primary driver of visceral obesity and its comorbidities. Cortisol also suppresses adiponectin secretion from adipocytes, removing a primary endogenous insulin sensitizer and further worsening peripheral resistance.
Sleep restriction activates the HPA axis, elevates sympathetic nervous system output, and directly impairs insulin sensitivity through the same cortisol and catecholamine pathways. Spiegel, Tasali, Leproult, and Van Cauter, reporting in Nature Reviews Endocrinology (2009), demonstrated that one week of sleep restriction to 5 hours per night reduced insulin sensitivity by approximately 25% in healthy subjects.
The Sex Hormone Dimension
Testosterone Deficiency in Men

Testosterone exerts direct effects on skeletal muscle insulin signaling through androgen receptor-mediated pathways, including upregulation of GLUT4 expression. As the primary tissue of insulin-stimulated glucose disposal, skeletal muscle mass is itself a metabolic asset and testosterone is a primary determinant of its maintenance. Testosterone deficiency drives sarcopenia (decreased muscle mass), reducing the disposal capacity of the body’s most insulin-sensitive tissue. It accelerates visceral fat accumulation, generating the very inflammatory environment that further impairs insulin signaling. Grossmann’s review in the Journal of Clinical Endocrinology and Metabolism (2011) characterized the bidirectional relationship: obesity and insulin resistance suppress testosterone, and testosterone deficiency worsens insulin resistance and metabolic risk.
Visceral adipose tissue is rich in aromatase, the enzyme that converts testosterone to estradiol. As visceral fat accumulates, aromatase activity increases, accelerating testosterone-to-estradiol conversion and driving secondary hypogonadism through estrogenic suppression of LH at the hypothalamic-pituitary axis. Inflammatory cytokines from visceral adipose tissue contribute independently to central LH suppression. Cohen’s mechanistic analysis in Medical Hypotheses (2001) characterized this as the hypogonadal-metabolic-atherogenic-disease connection — a self-sustaining loop in which each element drives the next.
The old age belly is more than an aesthetic problem for men, is the visible expression of evolving metabolic dysfunction resulting from persistent poor lifestyle habits amplified by physiological age related hormonal changes.
The Menopausal Transition in Women
Carr’s analysis in the Journal of Clinical Endocrinology and Metabolism (2003) documented what this transition produces: visceral fat accumulation that accelerates independently of total weight gain, worsening dyslipidemia following the pattern described above, and progressive insulin resistance. A woman can gain no weight during the perimenopausal years and still experience a significant shift in her metabolic risk profile, because the distribution of existing fat is changing, driven by the withdrawal of estrogen’s suppressive effects on visceral adipocyte activity.
The perimenopausal window, beginning 2 to 5 years before the final menstrual period, is the period when metabolic surveillance should intensify. It typically precedes the moment when either physician or patient is thinking in those terms.
The Pre-Menopausal Androgenic Fat Shift

Estrogen normally maintains subcutaneous fat distribution in women through lipoprotein lipase activity in gluteofemoral adipocytes and suppression of visceral adipocyte differentiation. Hyperinsulinemia disrupts this architecture through two parallel mechanisms. First, insulin stimulates ovarian theca cell androgen production through CYP17A1 upregulation, a pathway documented by Nestler et al. in the Journal of Clinical Endocrinology and Metabolism (1998) in the context of polycystic ovarian syndrome (PCOS) but operating through the same insulin receptor-mediated pathway independently of PCOS diagnostic status. Second, insulin suppresses hepatic synthesis of sex hormone-binding globulin (SHBG), as established by Plymate et al. in the Journal of Clinical Endocrinology and Metabolism (1988), raising free testosterone bioavailability independently of total testosterone levels. Standard total testosterone measurement will not detect this shift, direct SHBG measurement is required.
The result is androgenic fat redistribution toward visceral dominance in a pre-menopausal woman, without dramatic androgen elevation on standard testing, and potentially without meeting Rotterdam criteria for PCOS. The diagnostic categories of PCOS and its absence may represent points on a continuum, with hyperinsulinemia as the shared underlying driver operating at varying intensities.
SHBG is suppressed by hyperinsulinemia independently of androgen levels, and low SHBG is independently predictive of type 2 diabetes development in women. Ding et al., reporting in the New England Journal of Medicine (2009), demonstrated in prospective data that low SHBG predicted T2DM development in women with a strength of association comparable to established metabolic risk factors. It is an inexpensive, underutilized marker of insulin resistance that standard metabolic panels do not include.
Take away: abdominal fat accumulation in a pre-menopausal woman is not just an aesthetic problem but a major metabolic red flag. It warrants urgent medical evaluation, and the best laboratory test to request in such cases is SHBG levels.
In Summary
Across two pieces, a picture has been built. Insulin resistance begins as a normal biological tool. It becomes a disease through a process that is slow, largely invisible to standard screening, and self-amplifying by design.
The pancreas exhausts itself compensating. The stress system remodels fat toward the most metabolically dangerous depot. The hormonal architecture shifts against recovery in both men and women through distinct but parallel processes. The inflammatory environment generated by the disease through AGE-RAGE activation, polyol pathway oxidative stress, and cytokine output from visceral adipose fuels its own continuation. And the lipid pattern that emerges is not a parallel condition but a direct product of the same underlying resistance that medicine’s standard screening tools are failing to detect early enough to matter.
Overwhelming research evidence demonstrates this process is reversible with aggressive lifestyle modification. The highest chance of complete reversal is present at earlier stages, though remission, and more rarely reversal, is still possible at more advanced ones. Early diagnosis then becomes critical and the best tool is not a fasting glucose, or HbA1c, but an OGTT.
Part Three will show what happens to specific organ systems when the reversibility window is missed.
Found this article useful? Share your thoughts. Join the conversation below.
Educational content on The Metabolic Archives is free, because medical information should be accessible to everyone. If you find value and want to support the work, a paid subscription is available and genuinely appreciated. Visit the About Page for additional information.
The Metabolic Archives is for educational and informational purposes only, and is not intended as medical advice, diagnosis, or treatment, and does not constitute a doctor-patient relationship. Do not adopt any recommendation discussed in any article or guides published here, make changes or abandon any prescribed medical treatment without prior consultation with your physician. Always seek the advice of your physician or other qualified health provider for any questions regarding your medical condition and recommended treatment options.
By reading this post, you acknowledge that you have read and agree to the Terms of Service of The Metabolic Archives, which govern all use of this content including restrictions on reproduction.
© 2026 The Metabolic Archives. All rights reserved.
I just wanted to say I found this really really fun. Shared with some of my peeps will remark on my findings which are anecdotal tomorrow. Thanks for such a great article.
Excellent summary! This series really should be part of the physiology course taught in medical schools; I know I would have been a better physician overall had I learned this information in this fashion at the beginning of my career.